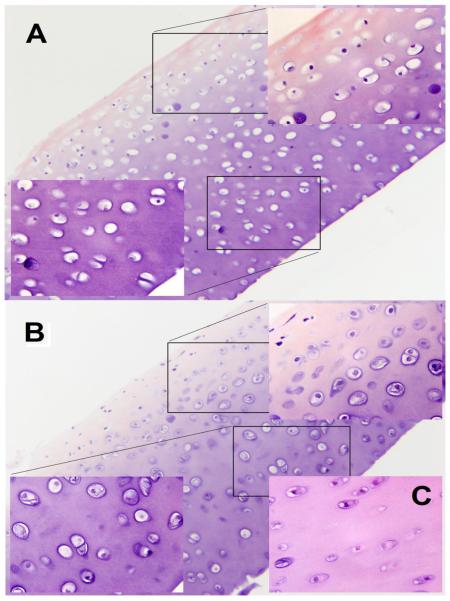
Figure 5.
A: Full-thickness view of knee cartilage, treated with saline for six months (Storage score: 3). The sample is oriented with articular surface to the upper left, and the deep zone to the lower right. Higher-power views of the articular surface and deep zone demonstrate chondrocytes filled with foamy storage material.
B: Full-thickness view of knee cartilage, treated with rhIDUA for six months (Storage score: 1). The sample is oriented like A, with higher-power views of articular surface and deep zone. Chondrocytes both at the surface and deep zone demonstrate more cytoplasm and much less storage than saline-treated chondrocytes.
C: Knee cartilage from a similarly aged, wild-type dog for reference.

