Figure 3.
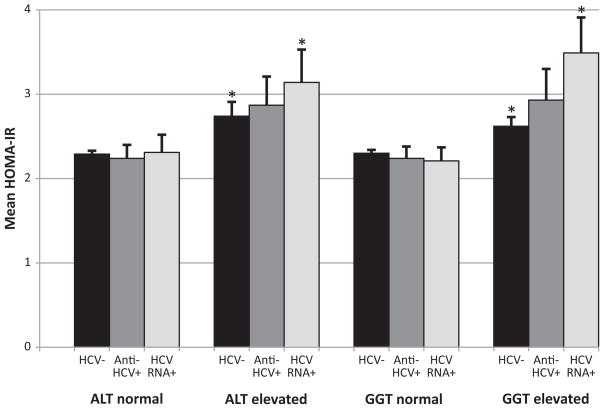
Figure 3a. Mean HOMA-IR according to enzyme activities (ALT and GGT) and presence of markers of HCV infection (anti-HCV+ or HCV RNA+) among participants with normal glucose. Error bars represent standard errors. Insulin resistance was estimated using homeostasis model assessment (HOMA). Means were adjusted for age, sex, race-ethnicity, education, alcohol use, smoking status, BMI, elevated C-reactive protein, and blood transfusion before 1992. *indicates p<0.05 compared to normal liver enzymes and HCV−. HOMA-IR, homeostasis model assessment of insulin resistance; ALT, alanine aminotransferase; GGT, gamma glutamyltransferase; HCV, hepatitis C virus; anti-HCV, HCV antibody.
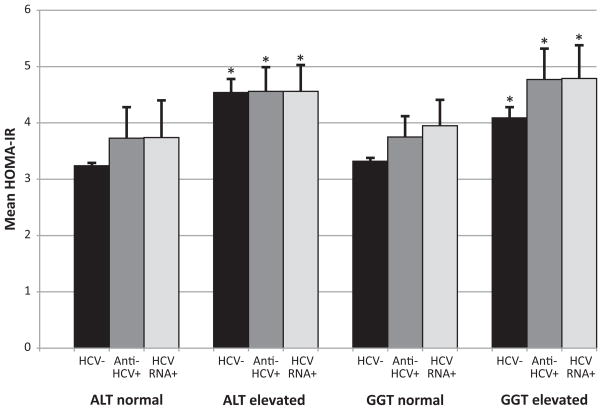
Figure 3b. Mean HOMA-IR according to enzyme activities (ALT and GGT) and presence of markers of HCV infection (anti-HCV+ or HCV RNA+) among participants with pre-diabetes. Error bars represent standard errors. Insulin resistance was estimated using homeostasis model assessment (HOMA). Means were adjusted for age, sex, race-ethnicity, education, alcohol use, smoking status, BMI, elevated C-reactive protein, and blood transfusion before 1992. *indicates p<0.05 compared to normal liver enzymes and HCV−. HOMA-IR, homeostasis model assessment of insulin resistance; ALT, alanine aminotransferase; GGT, gamma glutamyltransferase; HCV, hepatitis C virus; anti-HCV, HCV antibody.


