
Figure 1.
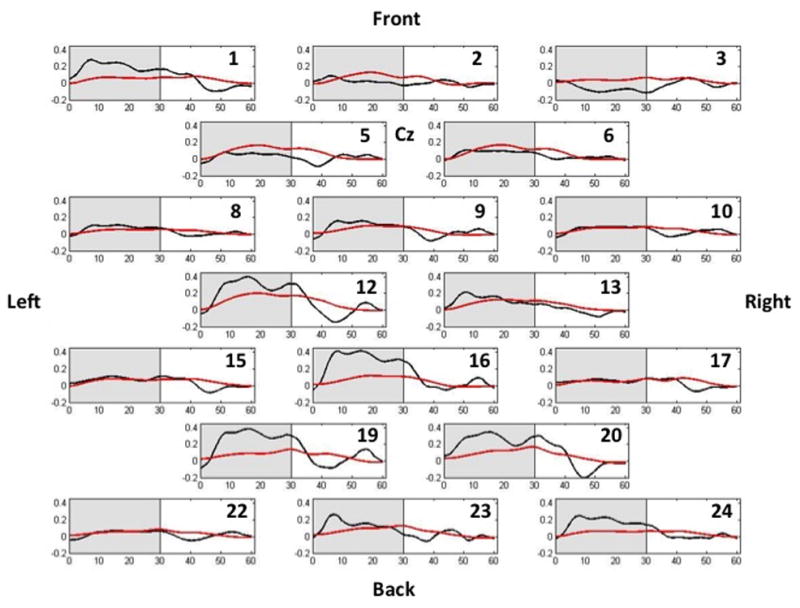
Representative time series of the oxyHb concentrations for all channels in children with CP (black lines) and TD children (red lines). The grayed area represents the active walking period, while the white areas represent the baseline period where the child is standing still. The approximate correspondence between channels and cortical areas was as follows: channels 1–3 and 5–6 were over the supplementary motor area, channels 8–10 and 12–13 were above the precentral gyrus, channels 12–13 and 15–17 were near the postcentral gyrus, and channels 19–20 and 22–24 were over the superior parietal lobule; see the Methods section for further information. As can be clearly discerned, the concentration of oxyHb was greater in children with CP across most channels. Units on the ordinate are Mmol × mm and seconds on the abscissa.