
Figure 3.
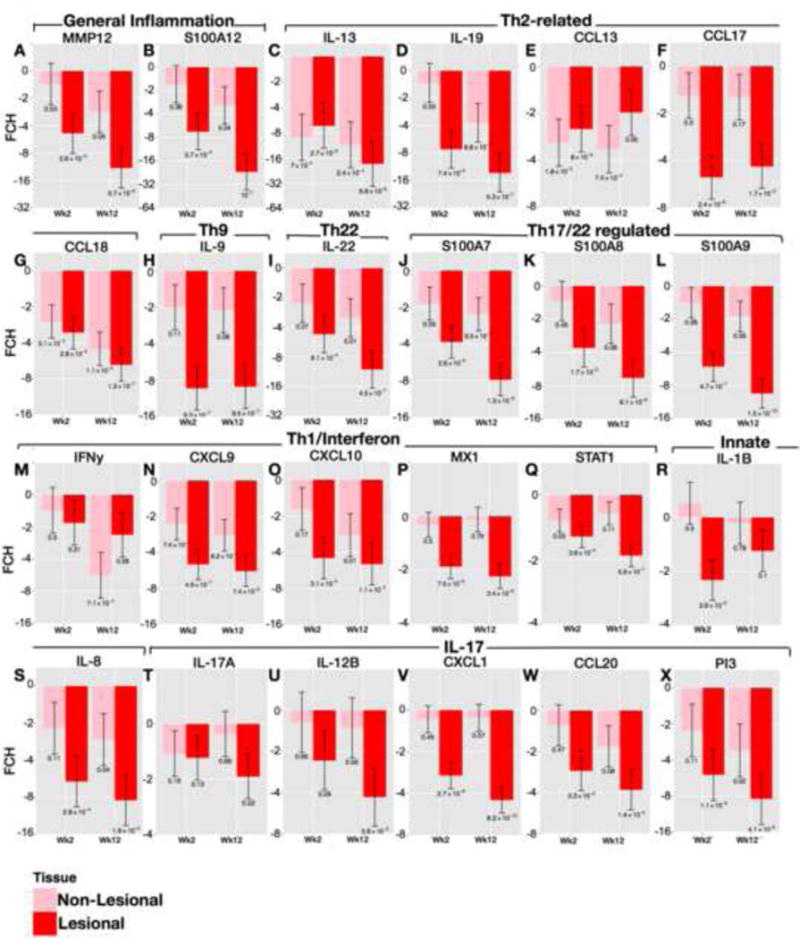
Significant down-regulation of inflammatory markers following CsA in AD skin as quantified by real-time/RT-PCR. A–X) Post-versus-pre-treatment mRNA expression differences (FCHs) of selected genes, as grouped by the inflammatory pathway, in LS and NL AD at wks2 and 12 of treatment. Wk/week; FCH/fold-change; Mean±SEM with post-versus-pre p-values. See Table E3 in OR for confidence intervals.