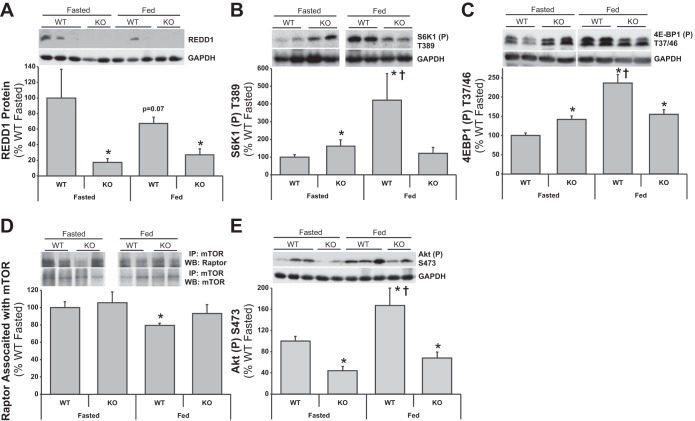
Fig. 6.
REDD1 WT and KO mouse muscle mTOR signaling responses to fasting and feeding. Equal protein from fasted and fed, REDD1 WT and KO male mice plantar flexor complex muscle homogenates were analyzed by Western blot analysis. A: REDD1 and actin, then normalized to actin. B: phospho-S6K1 T389 and actin, then normalized to actin. C: phospho-4E-BP1 T37/46 and actin, then normalized to actin. D: raptor and mTOR from mTOR coimmunoprecipitations. E: phospho-Akt S473 and actin, then normalized to actin. Representative Western blots are shown. Means marked with an * are significantly different, P < 0.05 vs. WT fasted; † are significantly different, P < 0.05 vs. KO groups (n = 7/group).

