Fig. 1.
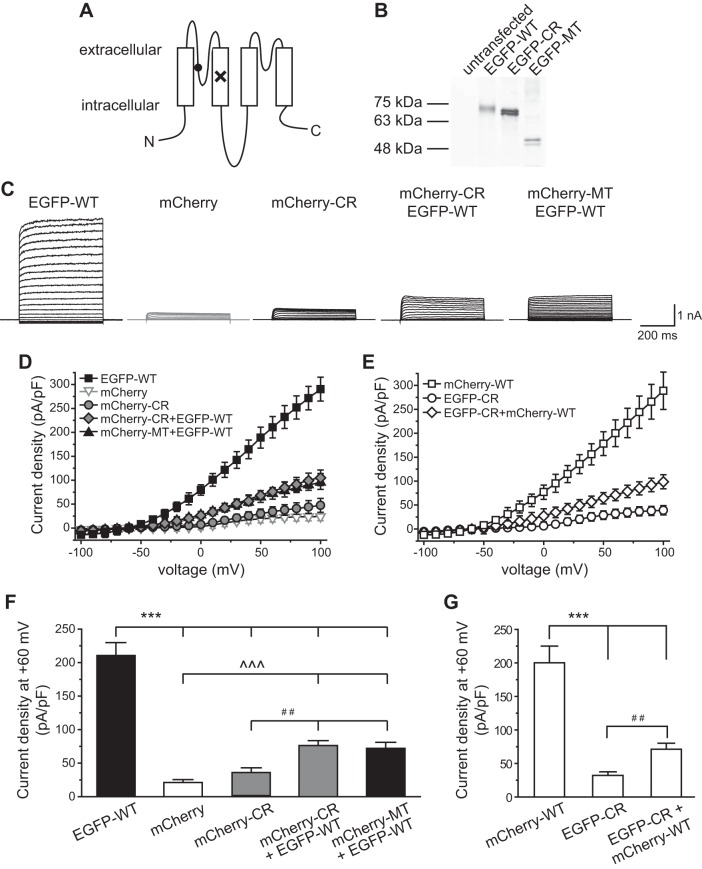
Dominant-negative effect of the TWIK-related spinal cord K+ (TRESK) C110R (CR) variant on whole cell K+ currents in HEK293T cells. A: topology of the mouse TRESK subunit. The locations of the frameshift mutation and the CR variant are labeled by × and ●, respectively. N, NH2 terminal; C, COOH terminal. B: characterization of enhanced green fluorescent protein (EGFP)-tagged wild-type (WT), CR, and mutant (MT) TRESK subunits in HEK293T cells by Western immunoblotting. The plasmid used in each transfection is indicated above. Ten microliters of lysate were loaded in each lane and were detected by an antibody against the EGFP tag. Lysate from untransfected cells is included as a control (left lane). The molecular mass markers are indicated at left. The variation in signal intensity likely results from different cell density and/or transfection efficiency between samples. C: representative current records from HEK293T cells expressing mCherry protein or various types of tagged TRESK subunits as indicated above. Transfected cells were held at −60 mV and were subject to 500-ms voltage steps from −100 to +100 mV (10-mV increments, every 10 s) and then repolarized back to −60 mV. D and E: current-voltage relationships (I–V) curves of peak TRESK current densities in HEK293T cells expressing mCherry protein or various types of TRESK subunits (the same recording protocols as in C, n = 8–14 cells in each group). F: TRESK current densities at +60 mV (the same cells as in D; one-way ANOVA with post hoc Bonferroni test; ***P < 0.001 and ^^^P < 0.001, compared with the EGFP-WT and mCherry groups, respectively; ##P < 0.01, compared with the mCherry-CR group). G: TRESK current densities at +60 mV (the same cells as in E; one-way ANOVA with post hoc Bonferroni test; ***P < 0.001, compared with the mCherry-WT group; ##P < 0.01).

