Fig. 4.
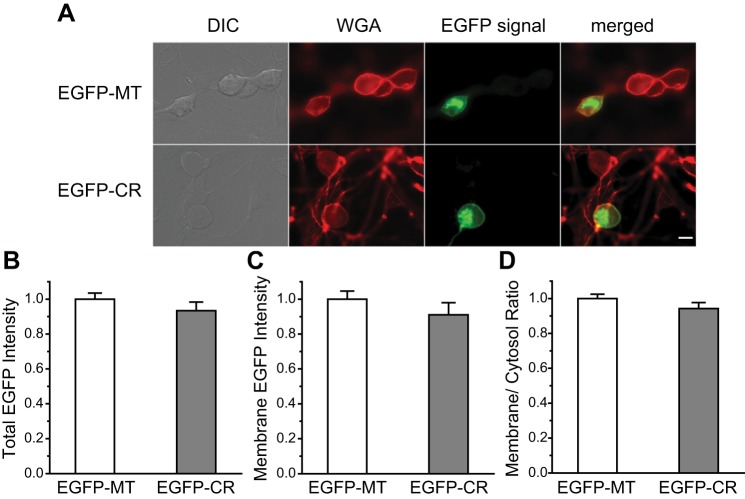
Total expression and surface expression of the TRESK CR and MT subunits are comparable in TG neurons. A: representative images of TG neurons expressing EGFP-MT and EGFP-CR TRESK subunits. Neurons were briefly stained with AF594-WGA to delineate the plasma membrane before fixation. Scale bar = 10 μm. B–D: normalized total (B), surface (C), as well as plasma membrane vs. cytosol ratio (D) of EGFP fluorescence intensity in TG neurons expressing EGFP-MT and EGFP-CR TRESK subunits, respectively (n = 30 cells in each group, same neurons in B–D). DIC, differential interference contrast; WGA, wheat germ agglutinin.

