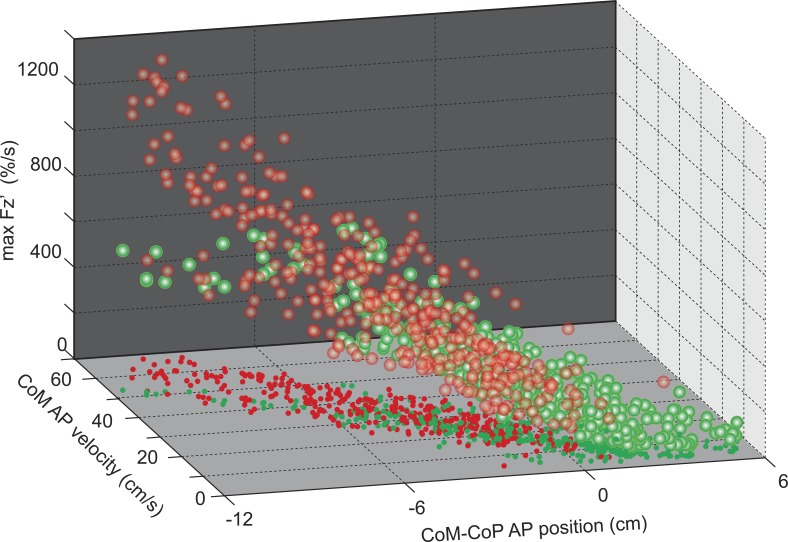
Fig. 6.
Interrelation between weight shift, VCoM and bipedal balance. Each subject's condition averages for max, VCoM at SO and CoM-center-of-pressure (CoP) distance at SO. Red dots with white center indicate data from HU, and green dots with white center indicate AT. Smaller solid dots mark the projection of data onto the horizontal plane. For each group, data for the slowest conditions are toward the front lower right and fastest conditions are in the rear upper left. The majority of variance across condition and group (91.5%) is described by a single principle component revealing a strong relationship between these three variables. However, AT data are shifted along this component toward a further forward CoM, slower VCoM and lower max relative to HU.

