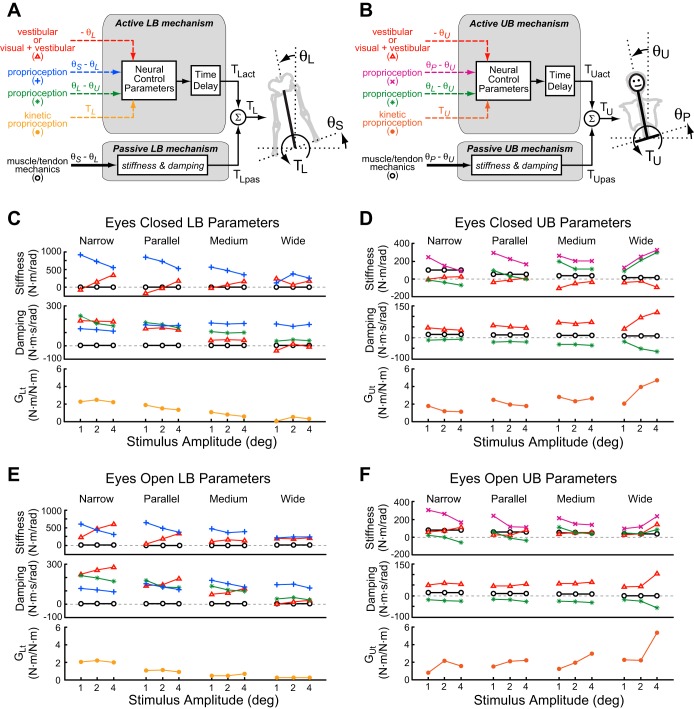
Fig. 3.
Block diagrams representing lower body (LB; A) and upper body (UB; B) feedback control mechanisms that generate corrective torques as a function of sensory signals encoding joint motion, segment orientation, or muscle torque (active torque, TLact and TUact) or as a function of passive mechanics associated with muscle/tendon stretch (passive torque, TLpas and TUpas). In the block diagrams, physical segment kinematic variables are represented with thick solid black lines, sensory signals encoding segment kinematics or torques are represented as dashed lines, and joint torques are thin solid black lines. θU is the UB angle, θL is the LB angle, θP is the pelvis angle, θS is the surface angle, TU is UB torque, and TL is LB torque. The active mechanisms include a time delay and a set of neural control parameters that specify the transformation from sensory signals to corrective torque. Across all stimulus amplitudes and stance widths, the control parameters, identified from fits to the across-subject mean FRFs, are shown for EC LB control (C), EC UB control (D), EO LB control (E), and EO UB control (F). Plot symbols used in C and E are associated with sensory and mechanical signals defined in the block diagram of the LB control mechanism shown in A, and symbols used in D and F are defined in the block diagram of the UB control mechanism shown in B. Stiffness parameters generate torque in proportion to angular deviations, and damping parameters generate torque in proportion to angular velocity.

