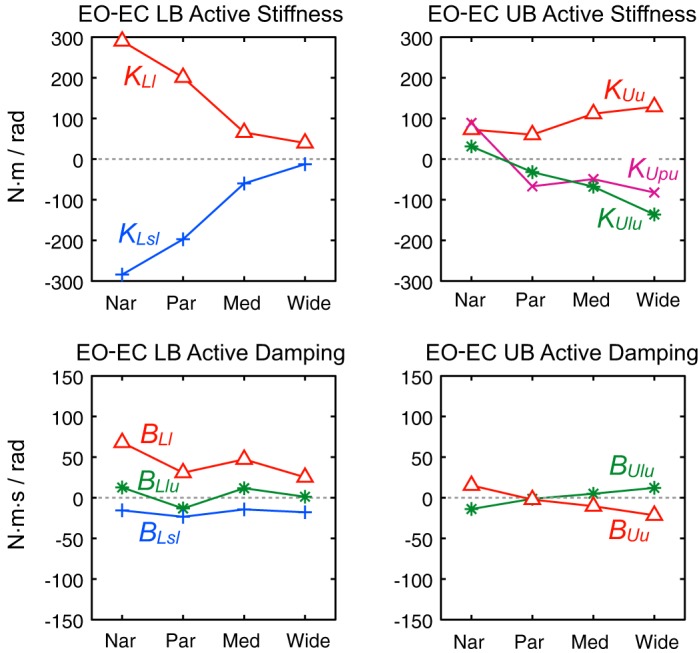
Fig. 5.

Comparison of EO and EC sensory feedback parameters. EO and EC parameters were averaged across the 3 stimulus amplitudes for each of the 4 stance widths. All results are based on parameters from fits to across-subject mean FRFs. Plots show EO minus EC parameter values for the LB (left) and UB parameters (right). Values greater than zero indicate that parameters were greater in EO compared with EC conditions.
