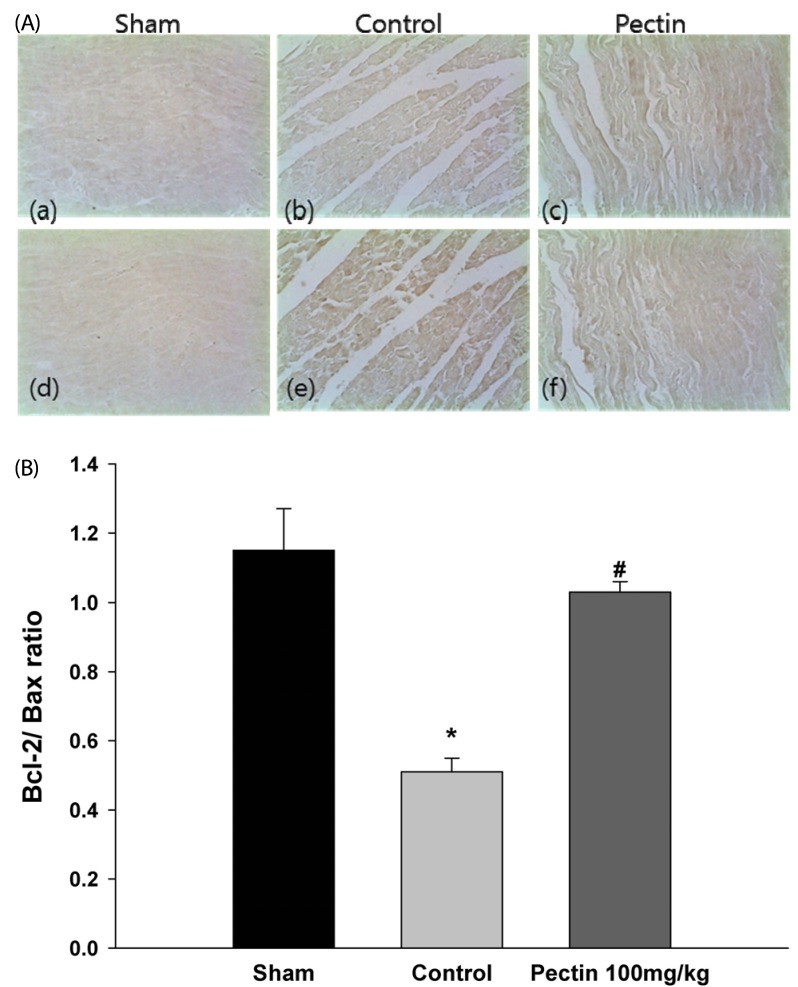
Fig. 4.
Effect of apple pectin (AP) on expression of Bcl-2 and Bax. (A) Photomicrographs of myocardial tissue sections showing Bcl-2 and Bax expression (200×): (a), (d) sham group; (b), (e) control group; (c), (f) AP-treated group (with 100 mg/kg/day). Photomicrographs were randomly taken from BZ. (a)~(c) and (d)~(f) represent Bcl-2 and Bax, respectively. (B) Quantitative analysis of Bcl-2 and Bax. Bcl-2/Bax ratio was used. The numbers of rats used in the sham, control, and AP-treated groups were 5, 5, and 5, respectively. *P < 0.05 control vs. sham group, #P < 0.05 AP-treated vs. control group.

