
Table 2.
Anthropometric variables, blood pressure and blood profiles of Vietnamese women according to hsCRP
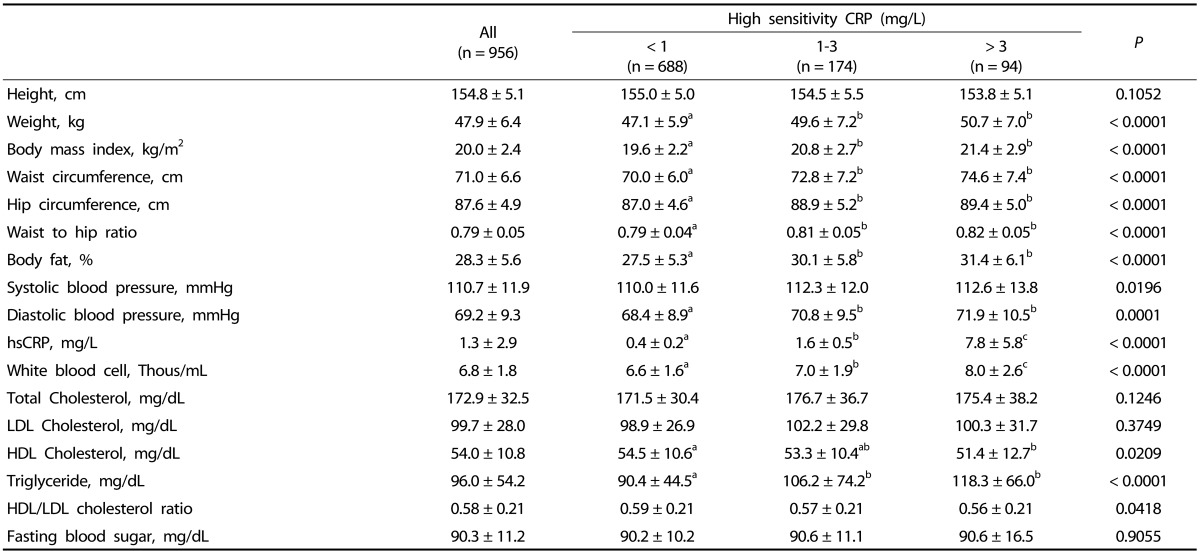
Values are mean ± standard deviation.
Values with different alphabets are significantly different among the three groups by GLM at P < 0.05 as appropriate; including the post hoc comparisons of Tukey.