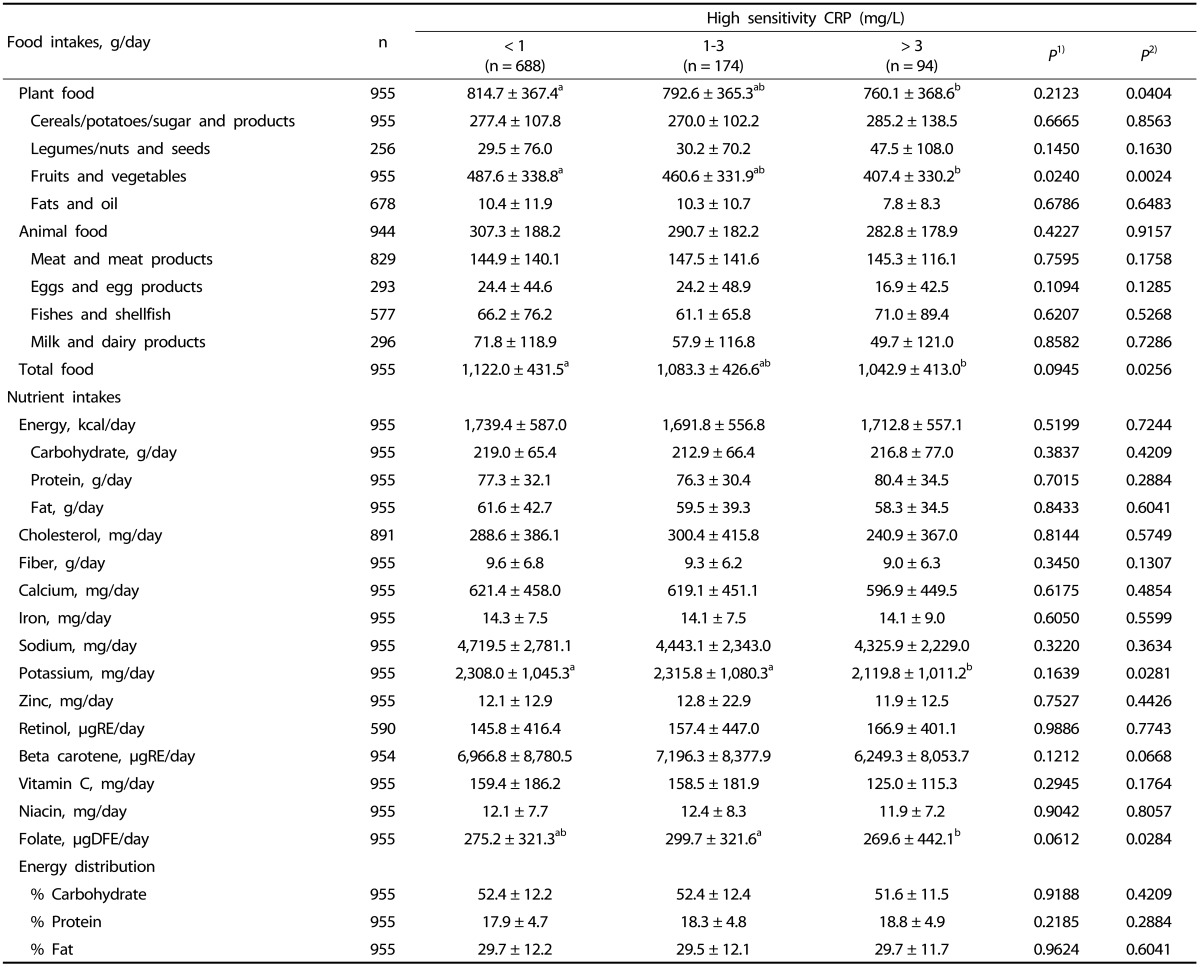
Table 3.
Daily food and nutrient intakes according to hsCRP

Fruits and Vegetables; Vegetables, mushrooms, seaweeds, fruits
Values are mean ± standard deviation.
Values are log transformed before analysis.
1)From GLM test; Unadjusted for variables
2)From GLM test; adjusted for age, body mass index, total energy intake, alcohol consumption, dietary supplement use, exercise.
Values with different alphabets are significantly different among the three groups by GLM at P < 0.05 as appropriate; including the post hoc comparisons of Tukey.
