
Table 4.
Odds ratio and 95% confidence interval of hsCRP (> 3 mg/L) according to quartile of food and nutrient intakes
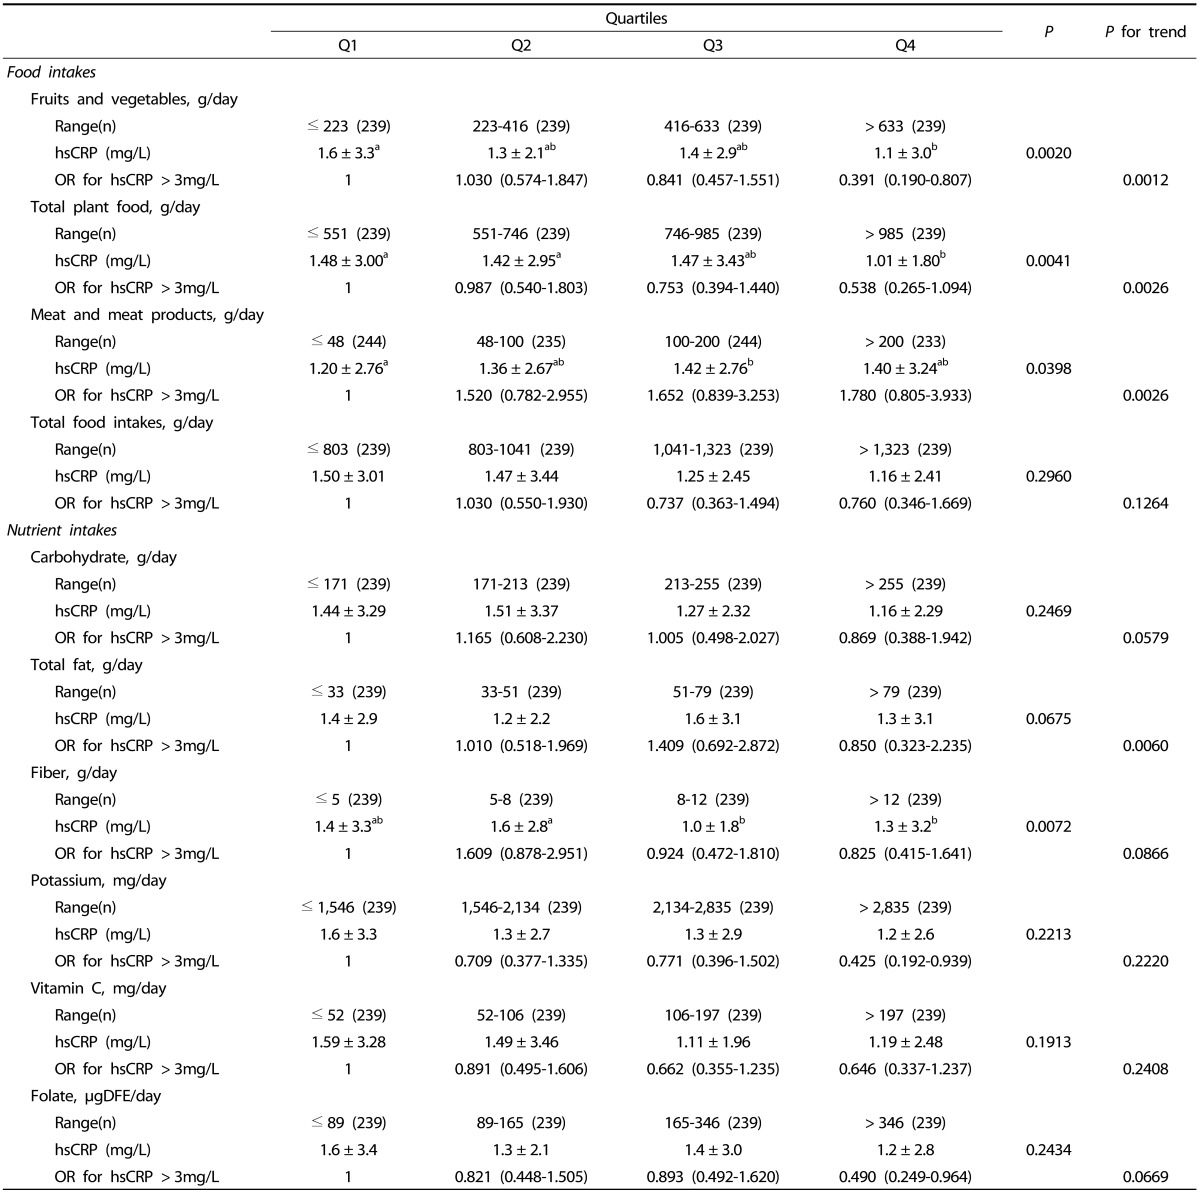
Values are mean ± Standard deviation.
Values are log transformed before analysis.
Adjusted for age, body mass index, total energy intake, alcohol consumption, dietary supplement use, exercise.
Values with different alphabets are significantly different among the three groups by GLM at P < 0.05 as appropriate; including the post hoc comparisons of Tukey.