Fig. 5.
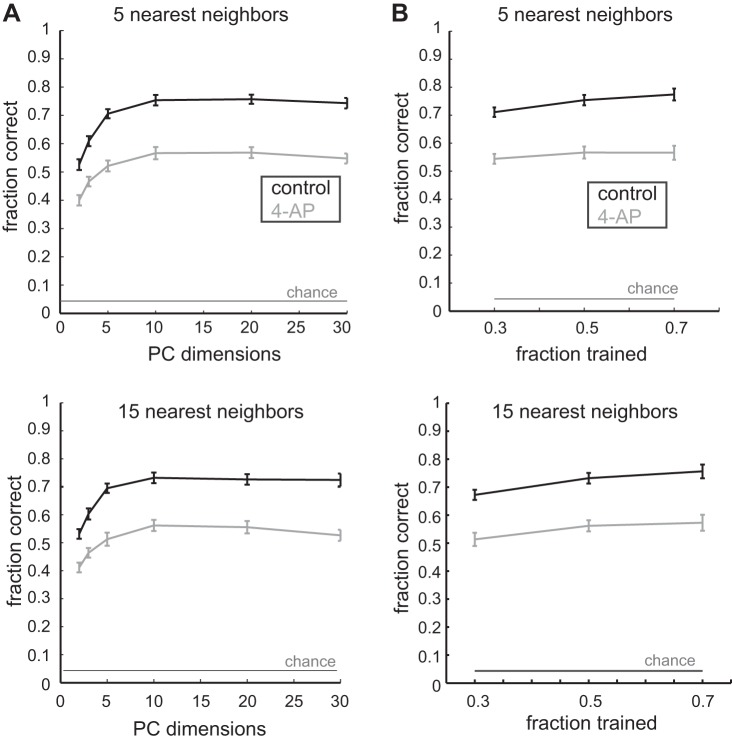
K-nearest neighbor classification of spike trains. A: classification accuracy as a function of PC dimensions used for 5 nearest neighbors (top) and 15 nearest neighbors (bottom). B: effect of fraction of trials used for training when 5 nearest neighbors (top) and 15 nearest neighbors (bottom). Control is in black, 4-AP is in gray, and chance percentage is shown.

