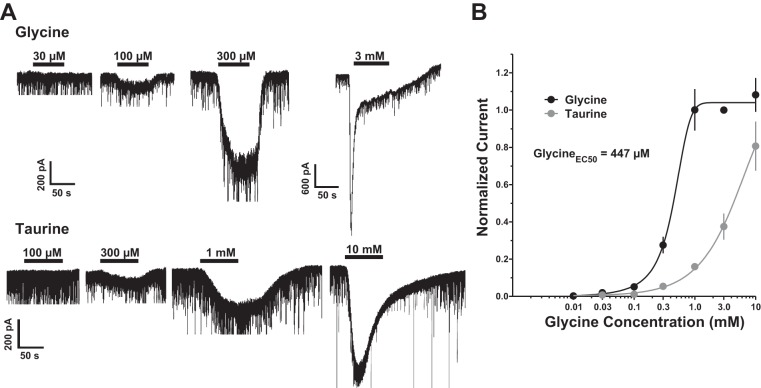
Fig. 6.
A, top: representative recordings under voltage-clamp conditions showing the response to exogenously applied glycine (30 μM–3 mM). Bottom: taurine application (100 μM–10 mM) causes a similar inward current at higher concentrations. B: glycine and taurine applications are shown on concentration-response curve normalized to 3 mM glycine for each neuron, where glycine EC50 = 447 μM and Hill slope = 2.56.

