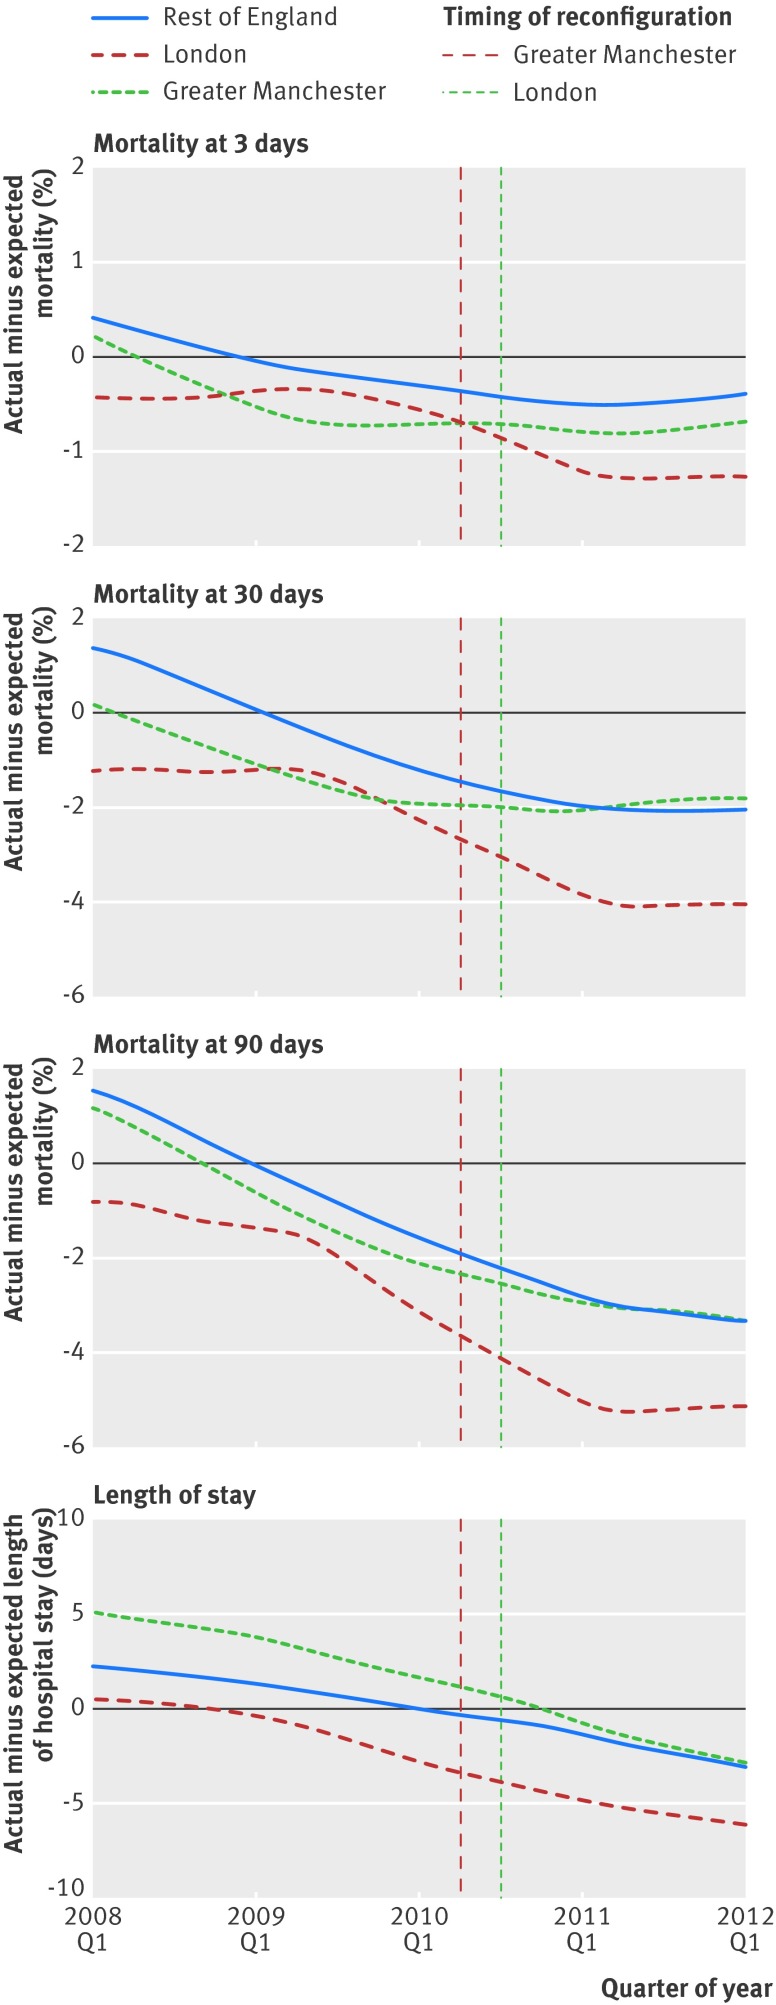
Fig 2 Risk adjusted mortality at 3, 30, and 90 days and length of hospital stay in Greater Manchester, London, and the rest of England by quarter. Differences between actual mortality and length of hospital stay and expected values derived from patient level risk equations are shown. In both areas some hospitals began to reconfigure their services before these dates; this is controlled for by using hospital and time fixed effects

An official website of the United States government
Here's how you know
Official websites use .gov
A
.gov website belongs to an official
government organization in the United States.
Secure .gov websites use HTTPS
A lock (
) or https:// means you've safely
connected to the .gov website. Share sensitive
information only on official, secure websites.
