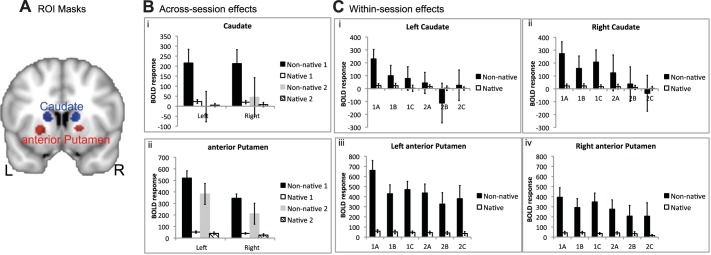
Fig. 3.

Regions of interest (ROI) for native and non-native repeating. A: ROI masks are shown in both hemispheres for the anterior putamen (red) and caudate (blue) on a coronal slice (y = 10). ROI masks are displayed on a standard brain template (MNI152). L, left; R, right. B: across-session effects are shown with the blood oxygen level-dependent (BOLD) response for non-native (black and gray) and native (open and hatched) repeating in both sessions (session 1, black and open; session 2, gray and hatched). Error bars represent 95% confidence intervals. Caudate ROIs are shown in i and anterior putamen ROIs in ii. C: within-session effects are shown with the mean time series for native and non-native repeating in each of the 3 runs for both scanning sessions for the left (i) and right caudate (ii) and the left (iii) and right anterior putamen (iv).
