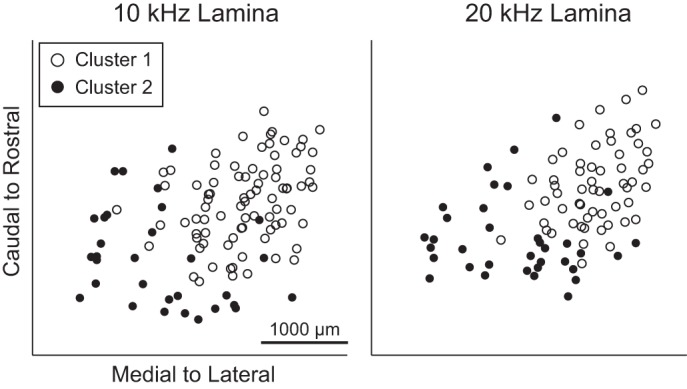
Fig. 10.

Clustering analysis reveals 2 distinct clusters in the caudal-and-medial vs. rostral-and-lateral areas. For the 10- and 20-kHz short tone stimuli, a k-means clustering algorithm assigned each point into 1 of 2 clusters based on the spiking parameters (after normalization, see text for details). The locations of sites assigned to cluster 1 are found in the rostral-and-lateral regions, whereas the site locations for cluster 2 are typically found in the caudal-and-medial regions across the ICC isofrequency lamina.
