
Fig. 5.
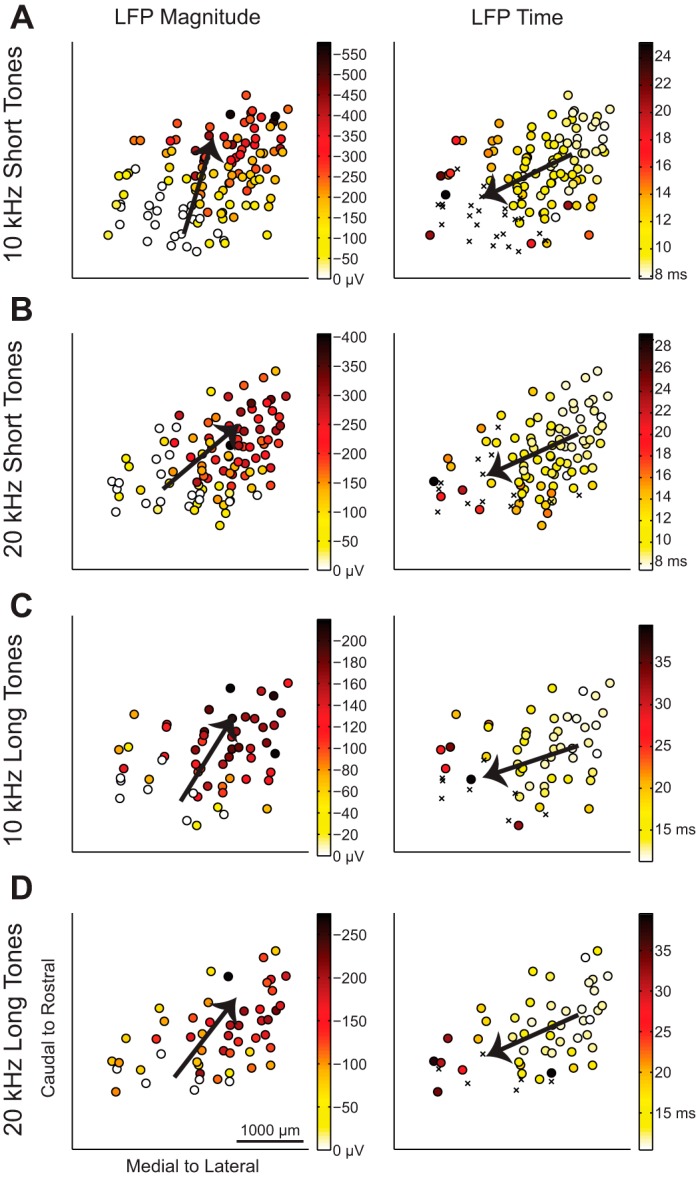
LFP response properties vary from caudomedial to rostrolateral across the lamina. The maps of LFP properties in response to 10-kHz short tones (A), 20-kHz short tones (B), 10-kHz long tones (C), and 20-kHz long tones (D) show response parameters recorded at each location. Multiple regression was performed to determine the steepest gradient axis (arrows). The LFP peak time was determined at threshold, and the LFP magnitude was determined at 4 dB above threshold. If the site did not exceed threshold, the LFP magnitude was labeled as 0 μV and included in the data analysis; those locations were not included in the LFP peak time analysis and are indicated (×) in the LFP time plots. See Table 1 for details on the regression statistics.