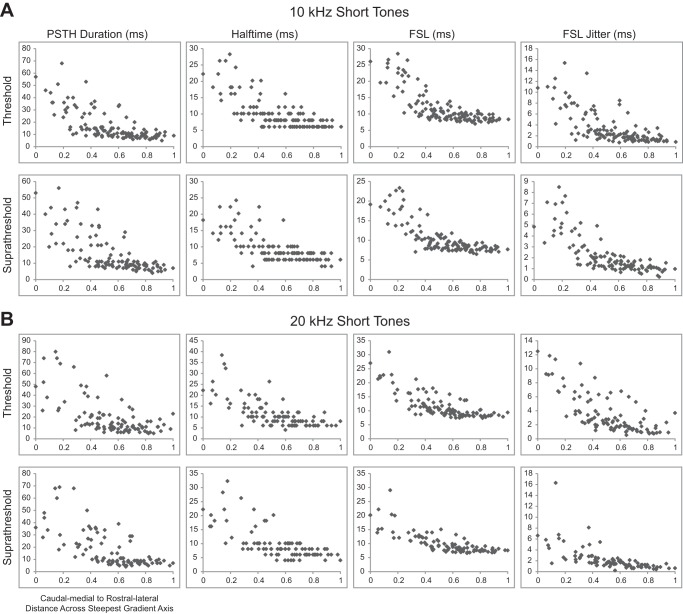
Fig. 7.
In response to short tones, differences of spiking properties from the caudomedial to rostrolateral areas suggest that the 2 areas are distinct clusters. The values of spiking parameters are plotted along the steepest gradient axis from the caudomedial (0) to the rostrolateral (1) endpoints along an ICC lamina in response to 10-kHz (A) or 20-kHz kHz short tones (B). The spiking parameters are small and similar in rostrolateral regions and increase rapidly in amount and scatter toward more caudomedial regions. Trends in spiking responses were similar across different stimulus levels. See Fig. 8 for spiking responses to the long tone stimuli.

