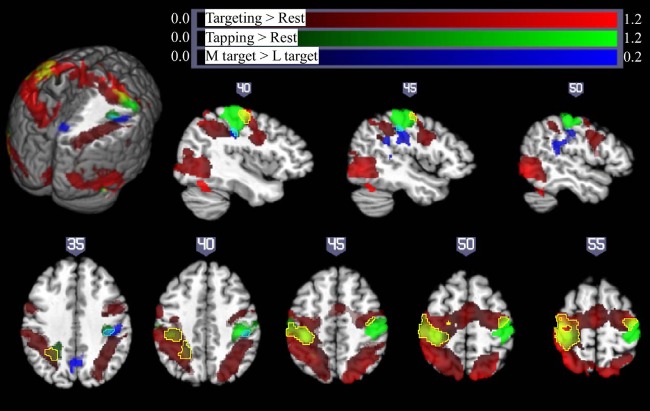
Fig. 5.
Pointing and finger-tapping task-related brain activation: activity related to the pointing task (collapsed across XL, L, and M targets) is indicated in red. Activation related to right- and left-handed finger tapping is indicated in green, with overlap between finger-tapping and pointing task performance shown in yellow. Note that while there was extensive bilateral activation for the pointing task, M1 activation in the finger-tapping tasks was only seen contralateral to the performing hand, so that the left hemisphere is due solely to right-handed finger tapping (with left hemisphere yellow areas show overlap between right-handed finger-tapping and right-handed pointing task performance) and the right hemisphere activity is due solely to left-handed finger tapping (yellow colors in the right hemisphere show overlap between activity due to the right-handed targeting task and left-handed finger-tapping task, outlined with a yellow border for ease of visualization). Significant activation related to increasing motor demand (M targets > L targets) is indicated in blue (overlap between this region and left-handed finger tapping shown in cyan, outlined for clarity). All activations are shown overlaid on the Colin27 template in standard space, thresholded at a corrected P < 0.05 (uncorrected threshold P < 0.005 and cluster size > 2,360 mm3) Increased color intensity corresponds to higher estimates of percent signal change. Cuts in the 3-dimensional rendering are shown at x = 0, y = −15, and z = 35. The right hemisphere is depicted at top. The right (R) and left (L) side of the brain are indicated at bottom. Numerical labels above each slice show slice coordinates in the x dimension (sagittal sections) or z dimension (axial sections).

