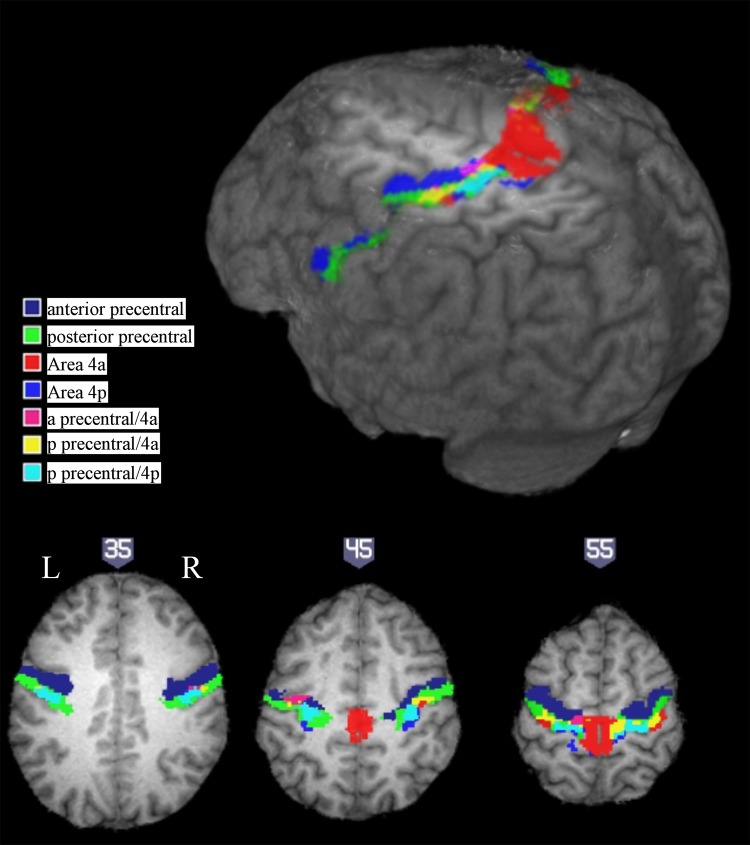
Fig. 7.
Cytoarchitectonic organization based area 4a and 4p and anatomically based hand-drawn anterior and posterior precentral gyrus ROI locations from a single representative subject (S2), overlaid on the participant's T1 image. Rendering cut shown at z = 50. Anatomical ROIs shown in blue (anterior precentral gyrus) and green (posterior precentral gyrus). Cytoarchitectonic organization based ROIs shown in red/violet/yellow (4a) and cyan/blue (4p) where secondary colors correspond to overlap with anterior precentral (4a: violet) or posterior precentral gyrus (4a: yellow; 4p: cyan). For illustrative purposes, the participant's structural image and anatomical ROI tracings have been normalized to template space. Note that the actual anatomical ROI analysis reported in Fig. 6 uses unsmoothed data in each subject's native space.

