Fig. 2.
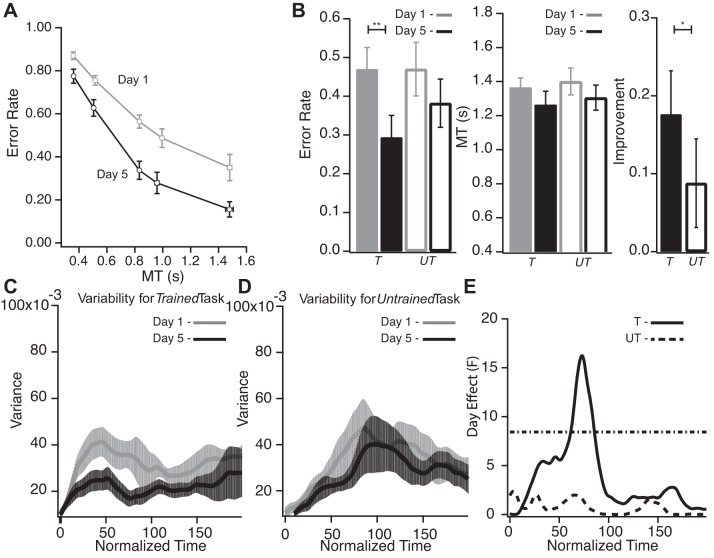
A: performance in the sessions in the lab before (gray, day 1) and after (black, day 5) training. Error rate (fraction of movements outside the channel) is plotted against average movement time for the 5 imposed movement times (MTs). This plot illustrates the group's SAF and its change after practice. Subjects showed reduction in error rate in all measured speeds, i.e., a shift across the SAF to a higher level of performance. Error bars denote SE. B: performance measures from the Trained (T) and Untrained (UT) tasks (performed in the scanner). *P < 0.05; **P < 0.01. Left: error rate reduction following training for the Trained (filled bars) and Untrained tasks (open bars). Center: subjects did not significantly change MT in either task after training. Right: improvement was greater for the Trained task. Error bars denote SE. C: average trial-by-trial variability from day 1 (gray) and day 5 (black) scanning sessions of the Trained task. Averaged variability is plotted against normalized time. After training, there was a reduction in variability mainly during the first half of the movement. Error bars denote SE. D: average trial-by-trial variability from day 1 (gray) and day 5 (black) scanning sessions for the Untrained task. Averaged variability is plotted against normalized time. Variability for the Untrained task did not change with time. E: comparison of variability measures across days: day effect (F values) as a function of normalized time. Dotted horizontal line represents the threshold (corrected for multiple comparisons) above which F values are statistically significant. Significant changes in variability can be seen for the Trained task (solid line) but not for the Untrained task (dashed line).

