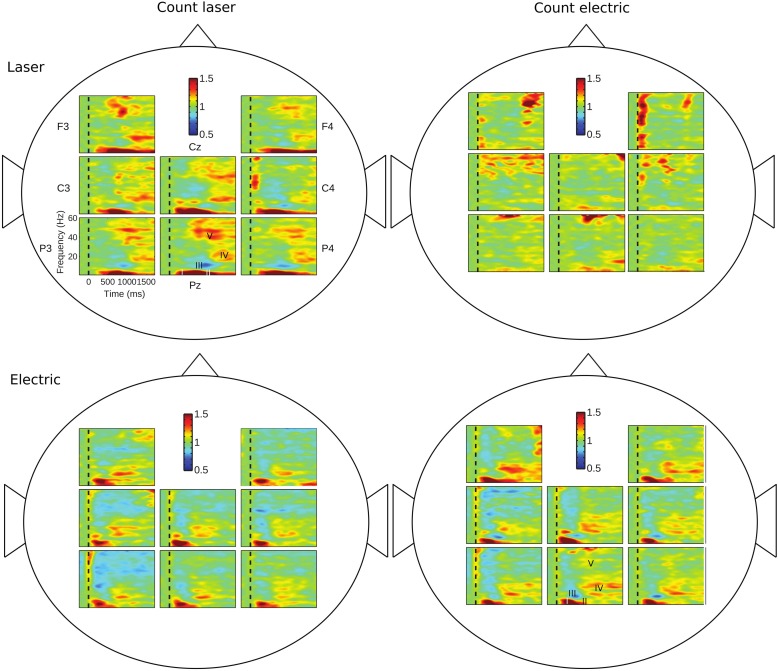
Fig. 2.
Time-frequency plots of ERS/ERD in all 4 Task by Modality combinations as averaged across all participants and within channels, as labeled in top left panel (Attention Task, Laser Modality). Conventions for axes and color scales are as described in the legend for Fig. 1 and as shown in top left panel of this figure.

