Fig. 2.
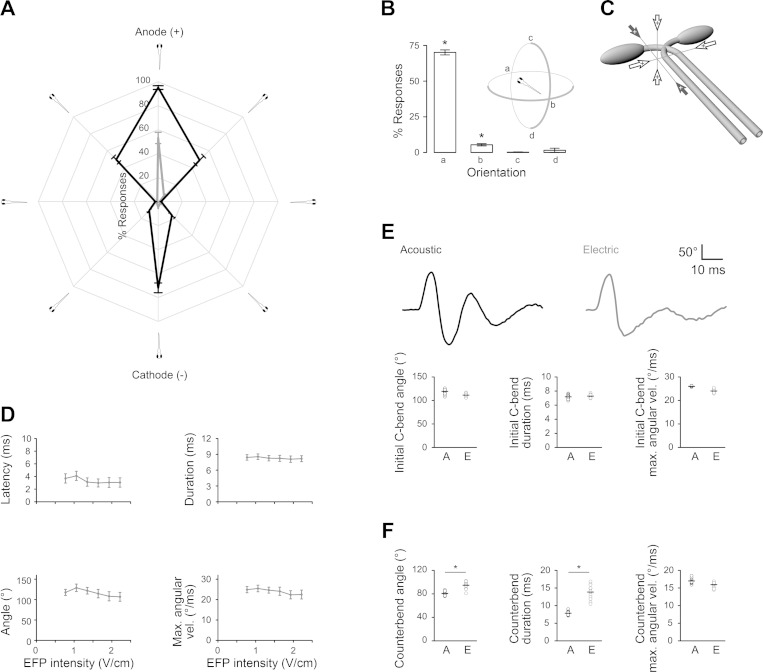
Orientation selectivity and kinematics for larval fish EFP responses. A: EFP responsiveness for larval orientations in the field. Azimuth: orientation, range: % of zebrafish responding (1.0 V/cm, gray; 1.3 V/cm, black; n = 14 groups of 30 fish). B: responsiveness for electrodes positioned with the anode above (c) and below (d) the larva. Intensity: 2.6 V/cm. n = 3 groups of 35 fish. *One-sample t-test against 0, P < 0.05. C: anode orientations that trigger (filled arrows) or do not trigger escapes (open arrows) relative to Mauthner cell bodies and axons. D: C-bend response kinematics to EFPs of increasing intensity. n = 6 groups of 30 fish. E, top: graphs show body curvature during acoustic and EFP-triggered C-starts. Bottom: kinematic analysis of initial C-bend of responses triggered by EFPs (E) and acoustic stimuli (A) showing angle, duration, and maximum angular velocity. n = 14 groups of 30 fish. F: kinematic analysis of counterbend of responses triggered by EFPs (E) and acoustic stimuli (A) showing angle, duration, and maximum angular velocity. n = 14 groups of 30 fish. *Paired t-test, P < 0.01.

