Fig. 3.
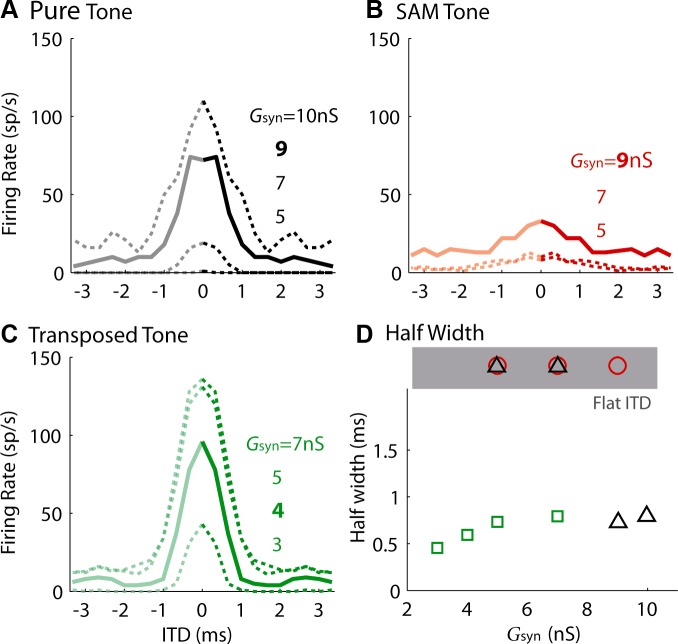
Effect of maximum synaptic strength, Gsyn (see Eq. 1), on ITD tuning of the pure tone (A), the SAM tone (B), and the transposed tone (C). The solid lines and the corresponding legend in bold were used to represent the neuron's ITD tuning for the population result in Fig. 4. The unitary EPSPs elicited by those chosen values of Gsyn were typically 3–4 mV. D: half-width as a function of synaptic strength. Note that the half-width was not computed for ITD tuning curve with a firing-rate range <30 spikes (sp)/s (marked as Flat ITD, shaded area). Tone/mf = 150 Hz. Sound level = 70-dB SPL.

