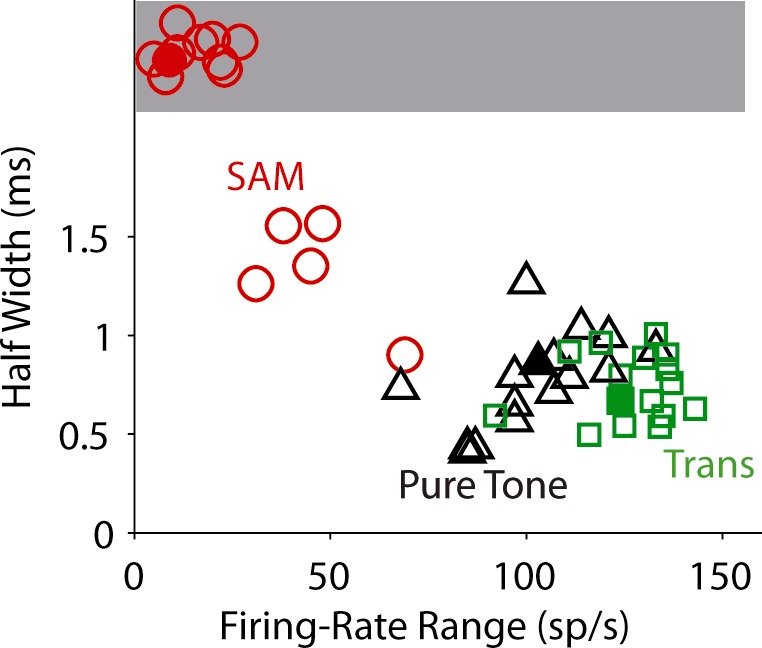
Fig. 4.

Scatter plots of firing-rate ranges vs. half-widths of the ITD tuning of recorded MSO neurons from animals aged P15 and older (open symbols; n = 14). The phasic-model performance is also plotted for comparison (filled symbols). Symbols in the shaded area correspond to flat ITD curves (firing-rate range < 30 sp/s). Small jitter was added to the data with flat ITD curves to avoid overlapping of the symbols. Tone/mf = 150 Hz. Sound level = 70-dB SPL.
