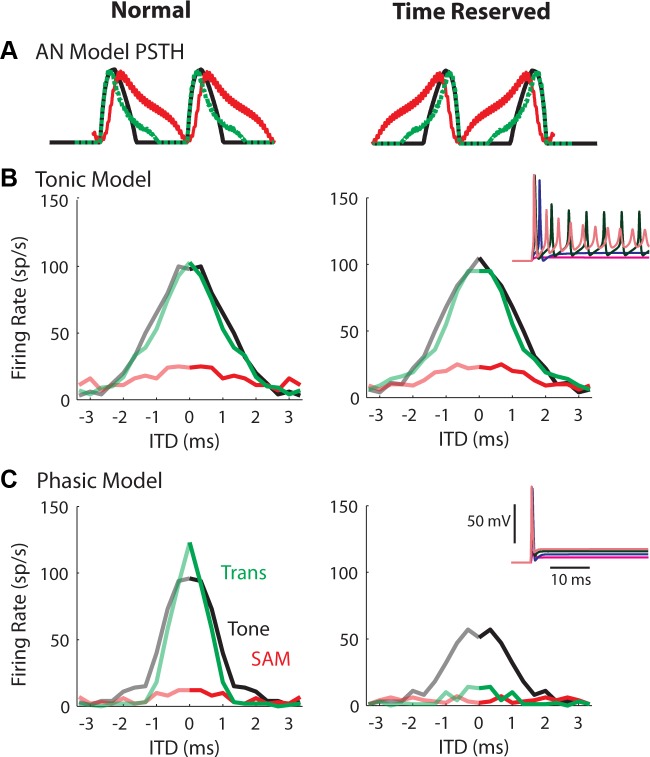
Fig. 6.
ITD tuning curves for sounds obtained from the tonic (B) and the phasic (C) models. Left: original AN input. Right: time-reversed AN input. The inset plots show the membrane responses to a step current input at various amplitudes (2, 5, 10, and 15 nS for the tonic and 10, 25, 50, and 75 nS for the phasic models, respectively). A: the AN input was similar to what MSO neurons received (Fig. 5A), and the synaptic strengths were adjusted based on the rule illustrated in Fig. 3, which generally yielded model firing rates similar to those of the neurons. Tone/mf = 150 Hz. Sound level = 70-dB SPL. Note that the time reversal protocol reduced the firing rate for the phasic model, but not for the tonic model.

