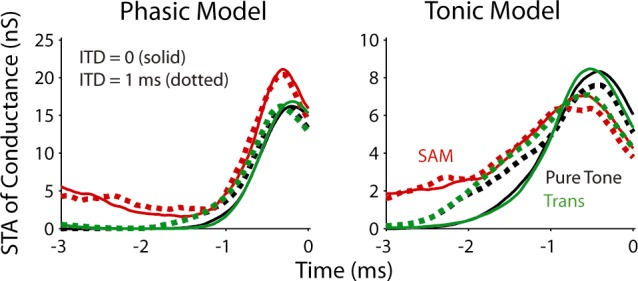
Fig. 7.

Spike-triggered averages (STAs) of input conductance for the three stimuli obtained with model simulations. Solid lines represent the result for ITD = 0, and dotted lines for ITD = 1 ms. Time 0 was when a spike was marked (i.e., the membrane voltage exceeded −15 mV).
