
Figure 2.
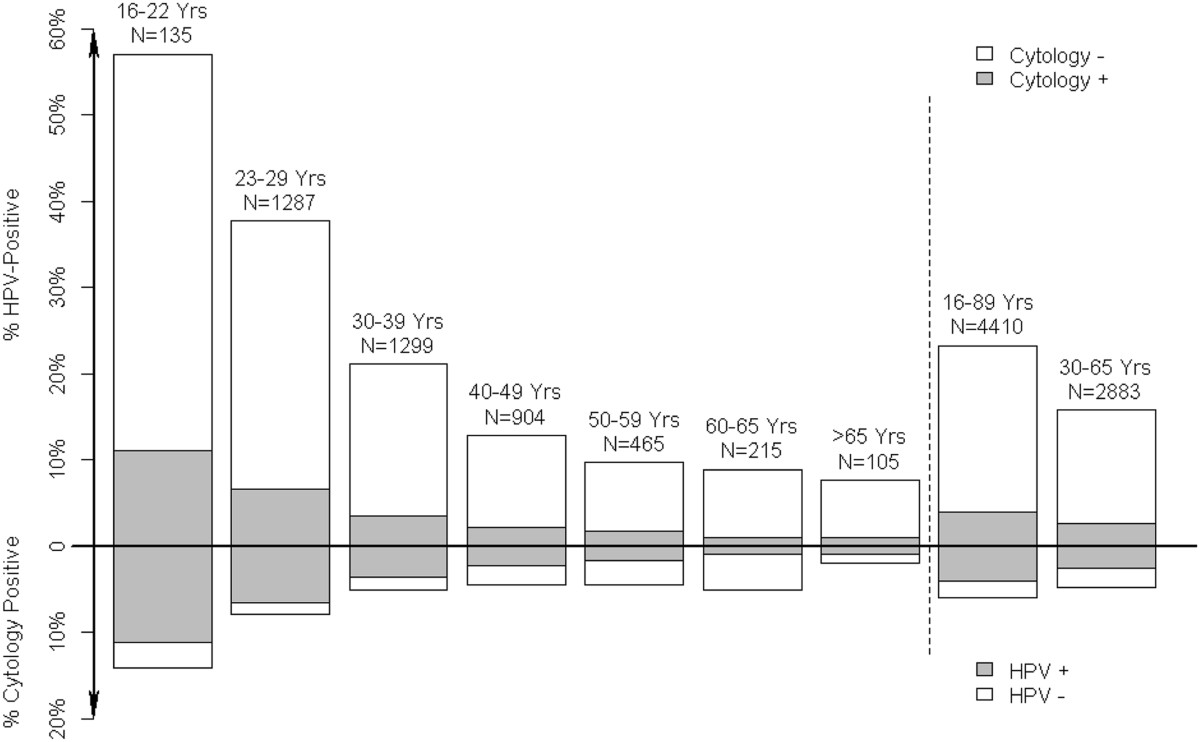
Proportions of the 4,410 screening samples testing positive on CLART, and with abnormal cytology, by age.
Official websites use .gov
A
.gov website belongs to an official
government organization in the United States.
Secure .gov websites use HTTPS
A lock (
) or https:// means you've safely
connected to the .gov website. Share sensitive
information only on official, secure websites.
Proportions of the 4,410 screening samples testing positive on CLART, and with abnormal cytology, by age.