Figure 1.

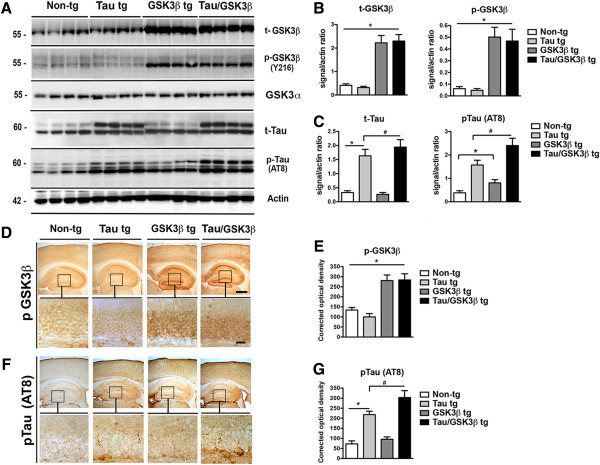
Characterization of Tau/GSK3β bigenic mice. (A) Representative immunoblot image for total GSK3β (t-GSK3β), phospho-GSK3β (p-GSK3β)(Y216), total Tau (t-Tau) and phospho-Tau (p-Tau) levels in the hippocampus of the Tau/GSK3β bigenic mice compared to Tau tg, GSK3β tg and non-tg mice. Actin was used as a loading control. (B) Analysis of levels of t-GSK3β and p-GSK3β showing 3 fold higher levels in GSK3β bigenic mice. (C) Analysis of levels of t-Tau and p-Tau (AT8) showing higher levels of p-Tau in bigenic mice compared to Tau tg mice. (D, E) Immunohistochemical and image analysis of pGSK3β immunoreactivity in the dentate gyrus of the hippocampus (inset) in the non-tg, single tg and Tau/GSK3β bigenic mice. (F, G) Immunohistochemical and image analysis of p-Tau (AT8) immunoreactivity in the dentate gyrus of the hippocampus (inset) in the non-tg, single tg and Tau/GSK3β bigenic mice The boxes indicate regions shown at higher magnification in the lower panels. Scale bar in upper panel = 250 μm, in lower panels = 30 μm. Error bars represent mean ± SEM (n = 6 per group, 6 m/o). *Indicates a significant difference (p < 0.05) between non-tg and single or bigenic mice analyzed by one-way ANOVA and Dunnett’s post hoc test. # Indicates a significant difference (p < 0.05) between Tau tg and bigenic mice analyzed by one-way ANOVA and Tukey-Krammer post hoc test.
