
Figure 2.
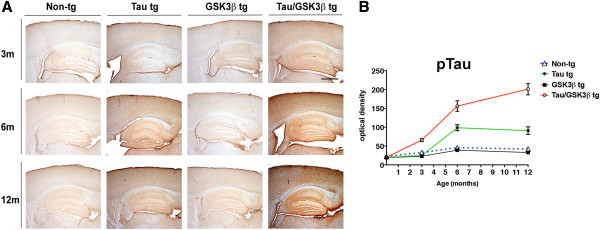
Comparison of effects of aging on p-Tau in non-tg single tg and Tau/GSK3β bigenic mice. (A) Representative images of immunohistochemical analysis with the p-Tau (AT8) in the neocortex and hippocampus in the non-tg, single tg and Tau/GSK3β bigenic mice at 3, 6 and 12 months of age. (B) Image analysis of optical density in the hippocampus represented as a line graph in the non-tg, single tg and Tau/GSK3β bigenic mice at 3, 6 and 12 months of age. Scale bar = 250 μm, in lower panels = 250 μm. Error bars represent mean ± SEM (n = 6 per age and genotype).