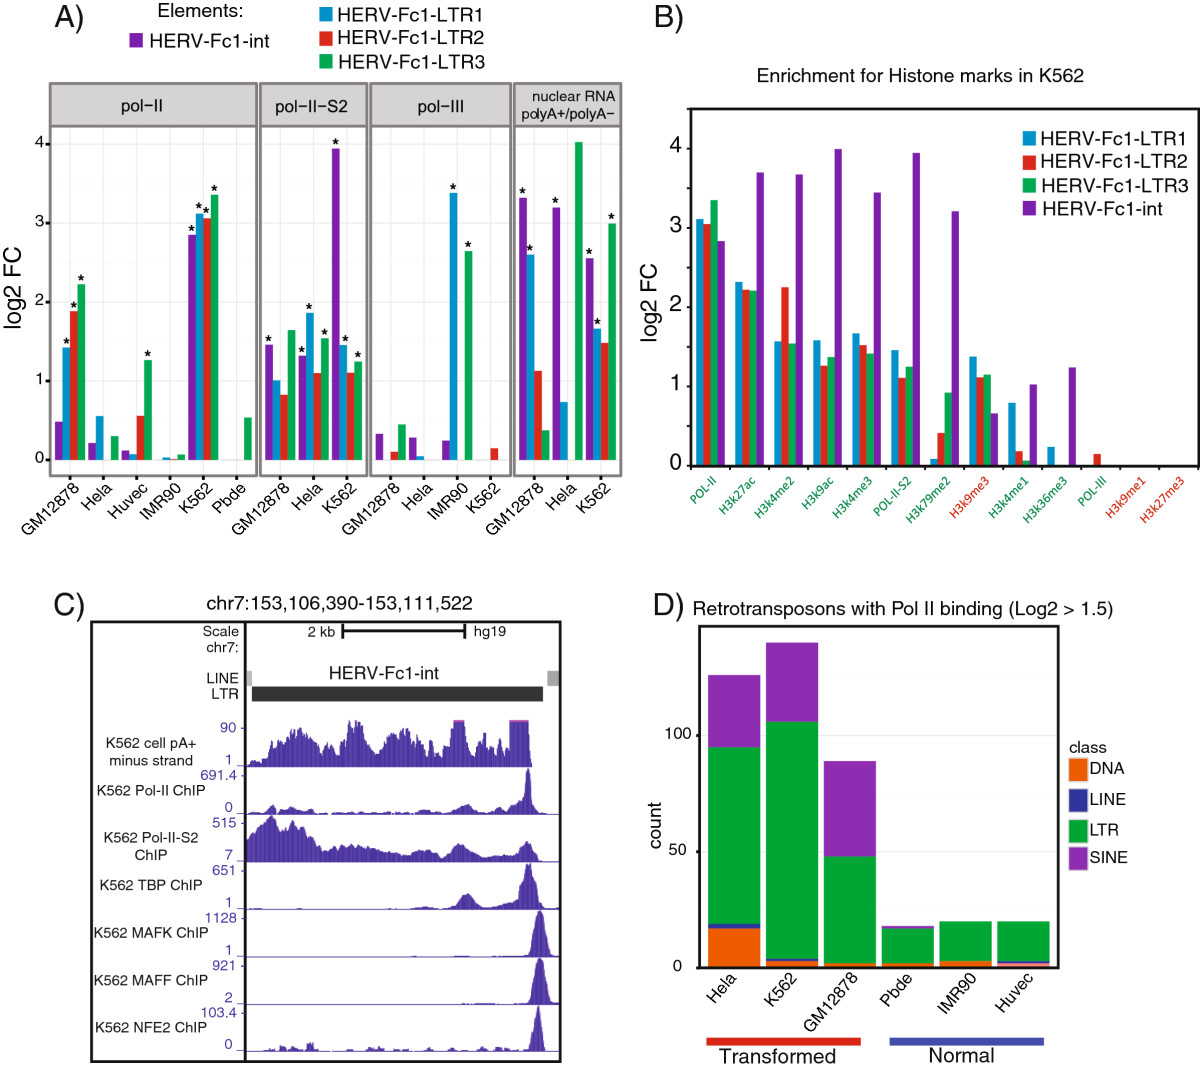
Figure 4.

HERV-Fc1 and Pol II binding in transformed vs. normal cell lines. LTR and other transposable elements displayed differences in RNA Pol II binding in transformed versus normal cell lines. A ) The LTR subfamily HERV-FC1 displayed cell line specific transcriptional profiles for the LTRs (LTR1-3) or internal region (int) of HERV-FC1. The GLM results are plotted as log2FCs for Pol II enrichment and differential RNA-seq analysis. The differential RNA-seq analysis compares the PolyA + vs. PolyA – enrichment of Nuclear RNA (positive log2FC values indicates PolyA + enrichment). B ) The enrichment of ChIP compared to input for RNA Pol II, active RNA Pol II-S2, active marks of transcription (H3K27ac, H3K4me2, H3K9ac, H3K4me3, H3K79me2, H3K4me1, H3K36me2) and repressed heterochromatin (H3K9me1, H3K9me3, H3K27me3) for the LTRs (LTR1-3) or internal region (int) of HERV-FC1. C ) Genome browser view of the primary locus of HERV-FC1-int contributing to expression in the K562 cell line. The ENCODE signal tracks for K562 cell PolyA + RNA (minus strand), RNA Pol II ChIP, RNA Pol II-S2 ChIP, TBP ChIP, MAFK ChIP, MAFF ChIP, and NFE2 ChIP were visualized on chr7. All other cell lines for which there was cell PolyA + RNA available displayed minimal signal at this locus. D ) The count of transposable elements displaying modest positive enrichment, log2FC >1.5, in transformed versus normal cell lines. The counts are colored by the class of transposable element.
