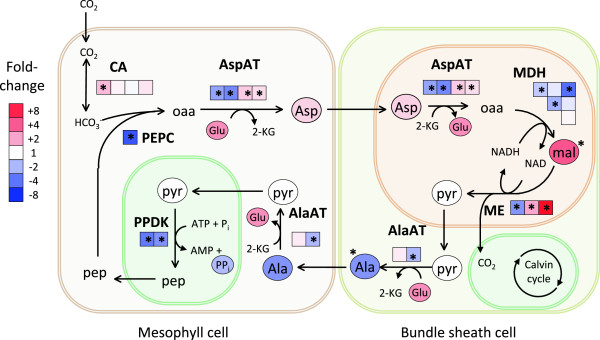
Figure 8.

Changes in C 4 photosynthetic processes during drought stress. NAD-ME pathway redrawn from (Maier et al., [51]). Colors of metabolites (ovals) and transcripts (squares) indicate fold differences in stressed plants relative to controls. Multiple transcripts matching each gene are ordered by expression (highest to lowest from left to right); transcripts expressed at low levels (<20% of most highly expressed transcript for each gene) are omitted for visual clarity. *: transcripts or metabolites significantly affected by treatment. AlaAT: alanine aminotransferase; AspAT: alanine aminotransferase; CA: carbonic anhydrase; Mal: malate; MDH: malate dehydrogenase; ME: malic enzyme; PEPC: phosphoenolpyruvate carboxylase; PPDK: pyruvate orthophosphate dikinase; Pyr: pyruvate.
