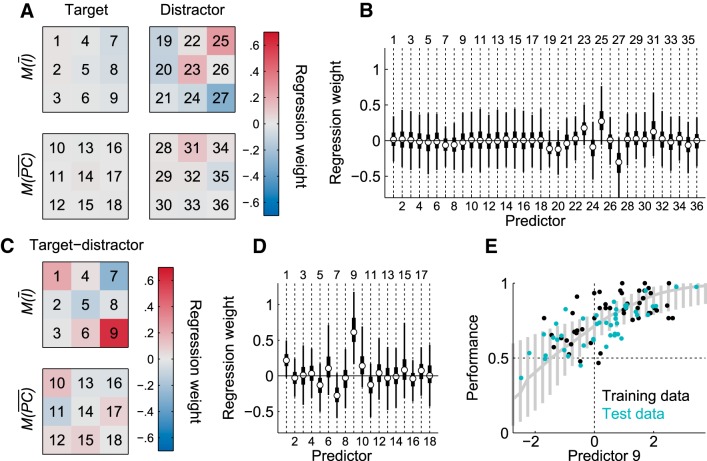
Figure 10.
Local luminance cues and performance. A, Templates based on modes of the posterior distributions of the regression weights for the 36 luminance predictors: average pixel values and mean absolute pixel change, each on nine locations of both stimuli (the nine squares in each template correspond to the nine locations on the square stimulus frames). Red indicates average luminance or pixel change in this area correlates positively with performance; blue indicates the reverse. B, Summary of the posterior distributions of the regression weights for each of the 36 predictors, with dots indicating the mode, thick lines the 50% HDI, and thin lines the 95% HDI. C and D are analogs to A and B, but show the results of a model based of the difference in each corresponding local luminance cue on the target and the distractor. Red indicates that a higher difference in average luminance or pixel change in this area for the target versus the distractor correlates positively with performance, while blue indicates the reverse. E, Performance on each target–distractor combination (dot) as a function of the luminance difference in the lower right corner (predictor 9 of the difference template, which is estimated to be different from zero). Only the training data (indicated in black) were used to fit the model. The mode of the posterior distribution and 95% HDIs are indicated in gray as a function of predictor 9. This panel shows that this predictor cannot explain generalization because the model's intercept does not coincide with chance level. At the intercept, where there is no average difference in luminance in the lower right corner of the screens between target and distractor (i.e., predictor 9 is equal to zero), performance is well above chance (as indicated by the data points and the 95% HDI shown in gray).

