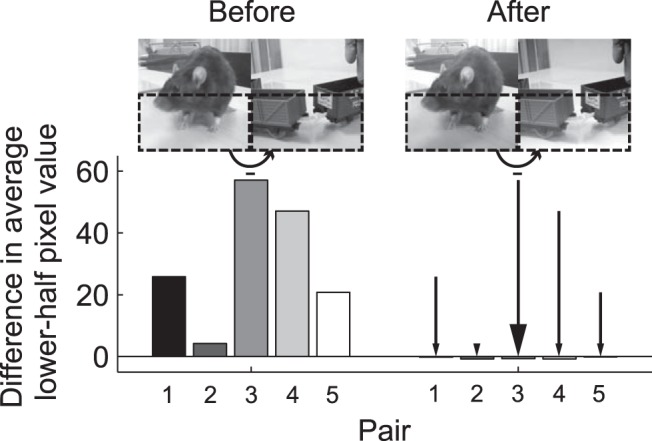
Figure 9.

Difference in average lower-half pixel value between target and distractor before and after the adjustment. Bar plots show the average (across width, height, and frames) pixel values in the lower half of the distractor movie subtracted from the same average of the target movie for each of the five pairs of Test Set 1 before (five bars on the left) and after luminance adjustment (five bars on the right). If a bar is not visible, its value is too close to zero. Positive values indicate that the lower part of the target movie is on average (across frames) lighter than the lower part of the distractor movie. Snapshots show the first frame of an example pair (corresponding to the third bar in each set of five, with the target on the left and the distractor on the right).
