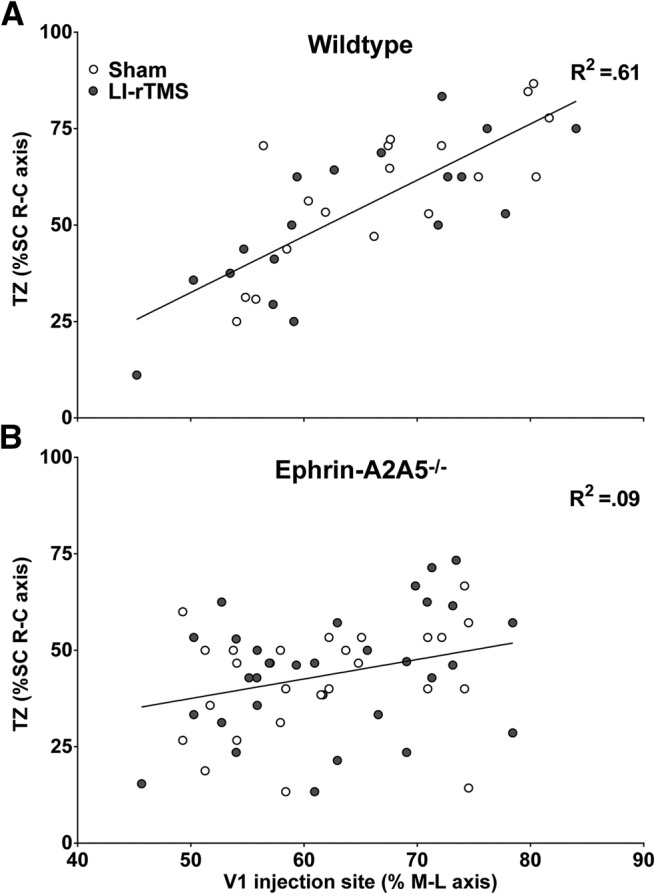
Figure 3.

Corticotectal TZ locations as a percentage of the superior colliculus rostral-caudal (R-C) axis are plotted as a function of V1 injection site location, as a percentage of the cortical hemisphere medial-lateral (M-L) axis. In wild-types (A), V1 injection location (percentage M-L) strongly and significantly predicted corticotectal TZ location (R-C axis). For ephrin-A2A5−/− mice (B), analyzing all TZs and successful injections together, V1 injection (percentage M-L) did not significantly predict TZ locations in the superior colliculus (SC) R-C axis and the relationship was weak. There was no significant difference between LI-rTMS and sham for either genotype. Lines represent linear best-fit regression.
