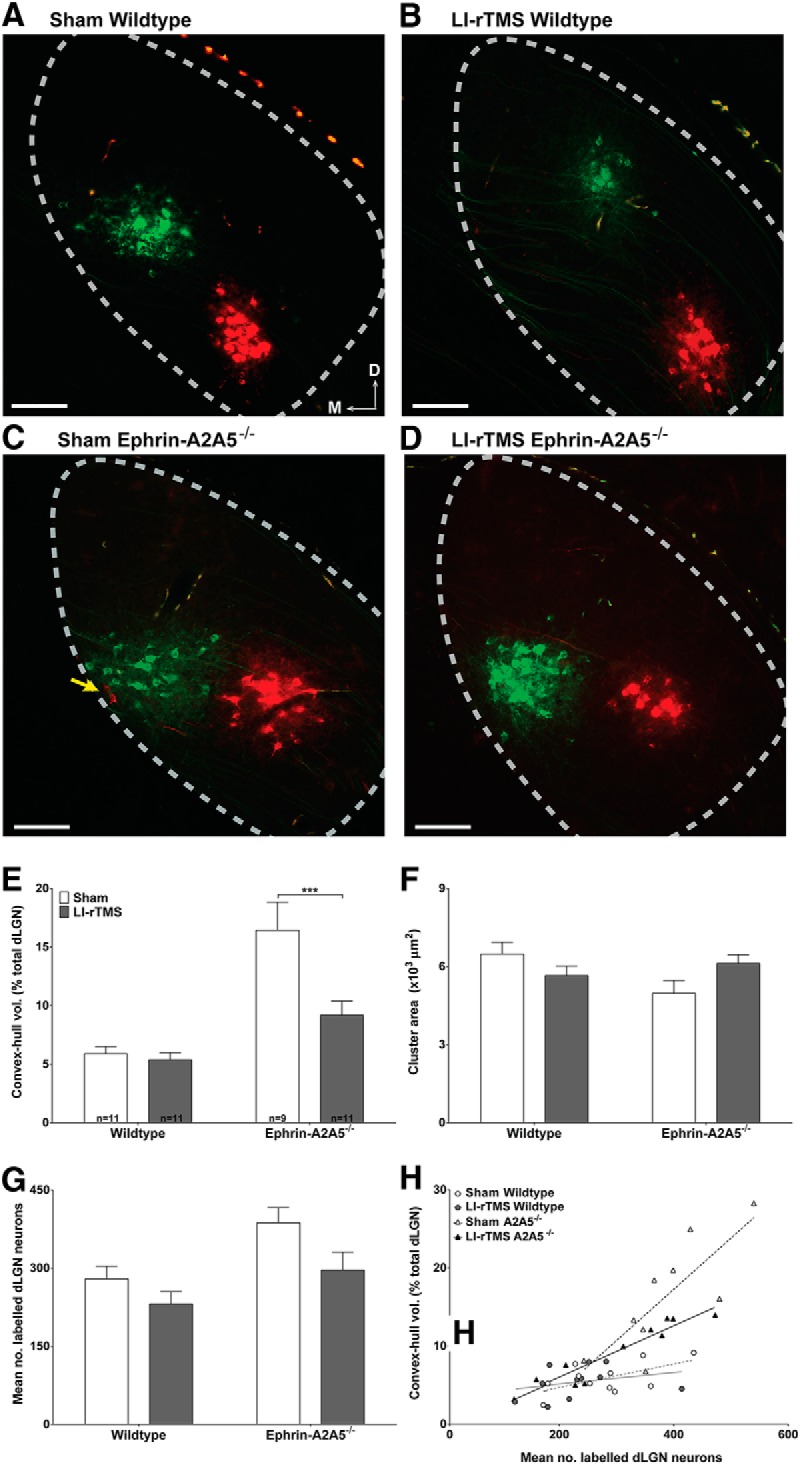
Figure 5.

LI-rTMS effects on retrograde labeling of the geniculocortical projection. A–D, Photomicrographs of retrogradely labeled neurons in the dLGN from a representative mouse of each genotype and stimulation condition. Cortical injections labeled a main cluster for all groups, suggesting largely normal geniculocortical topography. Note that wild-types in sham (A) and after 14 daily sessions of complex-waveform LI-rTMS (B) show similarly few neurons labeled outside the main cluster and similar cluster size, whereas the sham-treated ephrin-A2A5−/− mouse (C) shows labeled cells scattered across a larger area compared with the LI-rTMS-treated ephrin-A2A5−/− mouse (D) or wild-types (A, B). The yellow arrow indicates two red cells separated from the main red cluster, illustrating broad scatter of labeled neurons in the sham-treated ephrin-A2A5−/− mouse. Photomicrographs were digitally recolored from grayscale images and separate channels merged. Scale bars, 100 μm. E, Quantification of retro gradely labeled cell dispersion in the dLGN. The mean percentage of the total dLGN volume occupied by the convex-hull (in cubic micrometers), defined by the volume of straight lines joining the outermost labeled cells, was greatest in sham-treated ephrin-A2A5−/− mice and decreased with LI-rTMS; in wild-types, dispersion was similar between sham and LI-rTMS. F, Mean labeled neuron cluster area (in square micrometers) in the dLGN was similar between all groups. G, Mean number of labeled dLGN neurons. LI-rTMS decreased the number of labeled cells in both genotypes, although the magnitude of this decrease was greater in ephrin-A2A5−/− mice than in wild-types. Error bars indicate SEM. H, Cell dispersion (convex-hull volume as percentage total dLGN volume) as a function of total number of labeled dLGN neurons. Note that although sham-treated ephrin-A2A5−/− mice had somewhat more labeled neurons compared with other groups, at any given number of labeled neurons, dispersion tended to be greater in sham-treated ephrin-A2A5−/− mice than other groups. Lines represent linear best-fit regression. A2A5−/−, Ephrin-A2A5−/− mice; D, dorsal; M, medial. ***p < 0.001.
