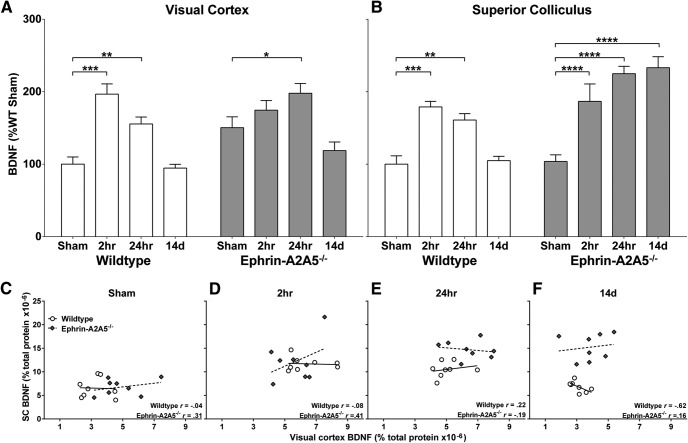
Figure 6.
BDNF concentrations in ephrin-A2A5−/− and wild-type mice, contrasting control, single, and multiple LI-rTMS session groups. BDNF concentration, normalized to percentage of wild-type sham, in visual cortex (A) and superior colliculus (B) 2 and 24 h after a single LI-rTMS session and after 14 d of daily LI-rTMS (24 h after final stimulation) are compared with sham (no stimulation control). C–F, Scatterplots of BDNF concentration (as percentage of total protein) between visual cortex and superior colliculus shown separately for each genotype and stimulation time point. All correlations were nonsignificant. Lines represent linear best-fit. *p < 0.05; **p < 0.01; ***p < 0.001; ****p < 0.0001.

