
Figure 7.
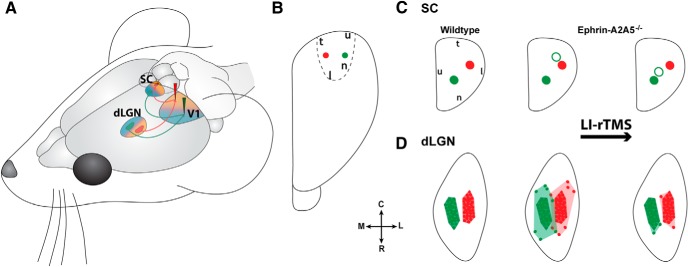
Summary of topographical reorganization effects of LI-rTMS. A, Schematic diagram illustrating appropriate topographic projections of the corticotectal (efferent) and geniculocortical (afferent) projections from medial (red) and lateral (green) locations in V1. Shading represents nasal (blue) and temporal (orange) visual field maps for each region. Arrows indicate direction of visual information flow. B, Dorsal view of the visual cortex showing injection sites. C, D, Dorsal view of characteristic labeling in superior colliculus (C) and dLGN (D) resulting from injections shown in B for wild-type and ephrin-A2A5−/− mice. After LI-rTMS (far right), ephrin-A2A5−/− mice showed a shift of ectopic terminal zones (open circles) toward a more topographically appropriate location in the superior colliculus, whereas the appropriate TZs (filled circles) were unaffected (C). In the dLGN, ephrin-A2A5−/− mice showed decreased labeled cell dispersion (D)—that is, a smaller convex hull volume (pale shading)—whereas the main labeled cell cluster (dark-shaded area) size remained the same. SC, Superior colliculus; R, rostral; C, caudal; M, medial; L, lateral; for the following, orientation refers to visual field: n, nasal; t, temporal; u, upper; l, lower.