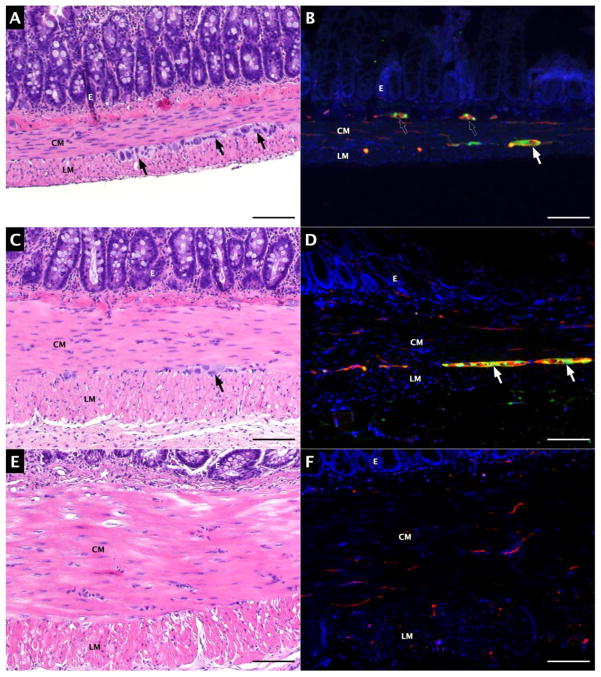
Figure 3.
Jejunal aganglionosis model. A) Hematoxylin and eosin (H&E) staining of normal jejunum; B) S100 (green) and TUJ1 (red) expression; C) H&E staining of isolated jejunum; D) S100 (green) and TUJ1 (red) expression in isolated jejunum; E) H&E staining of isolated, BAC-treated jejunum; F); S100 (green) and TUJ1 (red) expression in isolated, BAC-treated jejunum. Arrows indicate myenteric ganglia, and scale bars represent 100 μm.
CM: circular smooth muscle, LM: longitudinal smooth muscle, E: mucosal epithelium

