Fig. 1.

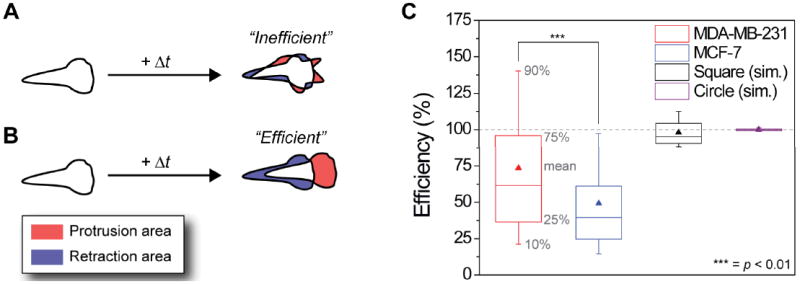
Efficiency η of cancer cell motility. (A) Schematic representation of a cell moving inefficiently, i.e., protrusions (shaded red) and retractions (shaded blue) occur at random locations along the cell boundary and do not lead to a significant net cell displacement. (B) A scheme of a cell that moves efficiently, where protrusions and retraction are oriented along the direction of net cell displacement. (C) Box-and-whisker plot showing the mean (triangle), the 90% percentile (top whisker), the 75% percentile (top box), the 25% percentile (bottom box), and the 10% percentile (lower whisker) of the efficiency of cell motility for each (3 min) time interval for all cells (averaged over 57 cells × 321 time points for each of the cell lines). The mean motility efficiency of metastatic MDA-MB-231 cells (red triangle) is 73.5%, while that of non-metastatic MCF-7 cells is 49%. This difference is statistically significant at the 99% confidence level (p < 0.01). As controls, purely translational (i.e., without any shape changes) motions of various shapes (shown here are a circle and square) were simulated and their efficiencies were found to be very close to 100% (see also ESI† Section S2). Note: for cancerous cells, some instantaneous efficiencies are above 100%, due to changes in the cell shape translating into large displacement of the centroid but relatively little protrusion and retraction activity (see Fig. S5).
