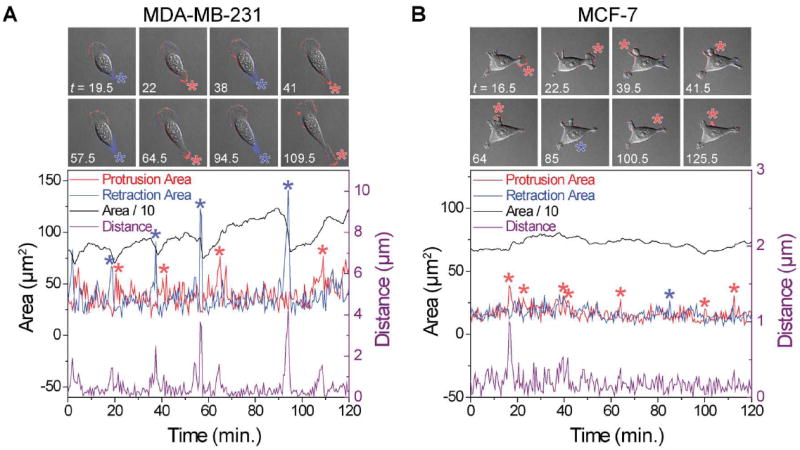
Fig. 2.

Typical experimental output of retraction–protrusion analysis for a typical single cell imaged at 30 s intervals. (A) A metastatic MDA-MB-231 cell moving persistently toward the top left corner of the images with nearly constant protrusion activity at the leading edge and intermittent large tail retractions (blue asterisks) followed by large tail protrusions (red asterisks). The largest cell centroid displacements (right y-axis) coincide with major retraction and protrusion events (see ESI† Movie M1). (B) A non-metastatic MCF7 cell, moving first to the right of the image (up to t = 31 min) and then to the left (after t = 31 min). Fluctuations in all variables are notably smaller compared to the MDA-MB-231 cell. No large retractions are observed. The insets above the graphs (each 110 by 110 μm) show the overlay of DIC images and the pixel-based analysis to visualize the protrusion area (red) and retraction area (blue). See also ESI† Movie M2. For clarity, only 2 hours of data is shown in the graphs.
