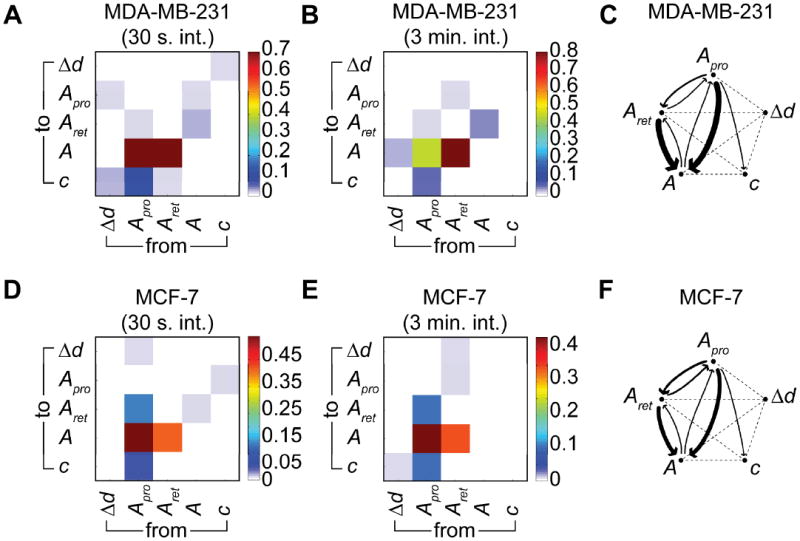
Fig. 4.

Granger causality analysis (p < 0.05) for the motility characteristics of MDA-MB-231 and MCF-7 cells. (A) Color-coded Granger causality coefficients for 15 MDA-MB-231cells sampled at 30 s intervals for 16 h. (B) The same as panel A but for 57 MDA-MB-231 cells sampled at 3 min intervals for 16 h. (C) Schematic representation of Granger causality flows, where the width of the arrow scales with the Granger causality coefficient. (D) Color-coded Granger causality coefficients for 15 MCF-7 cells sampled at 30 s intervals for 16 h. (E) The same as D but for 57 MCF-7 cells sampled at 3 min intervals for 16 h. (F) Schematic representation of Granger causality flows, where the width of the arrow scales with the Granger causality coefficient.
