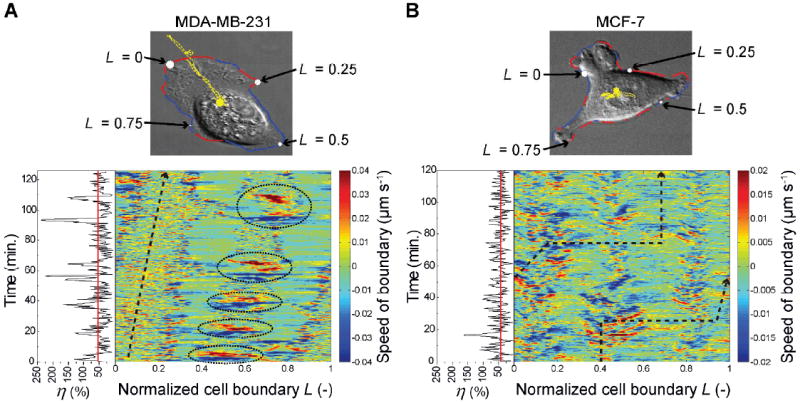
Fig. 5.

Representative boundary speed maps depicting the (color-coded) speeds along the normalized cell boundary (L) as a function of time. (A) MDA-MB-231 cell (same as in Fig. 2A, see also ESI† Movie M3). (B) MCF-7 cell (same as in Fig. 2B, see also ESI† Movie M4). In the images above the maps, coordinate L defines specific location at the cell perimeter and is normalized to between zero and one. The cell contour is colored red in places where the cell protrudes and blue where it retracts. The yellow curves trace the motion of the cells’ centroids. In the maps, the black dashed arrows delineate locations L along the cell boundary intersected by a vector originating at the cell centroid (yellow circle in images) and drawn in the direction of centroid displacement at time ti (see Fig. S10 for schematic representation). The instantaneous motility efficiencies, η (as defined in the main text, black lines) and the mean efficiencies (red lines) are shown on the left side of the boundary speed maps. For the specific MDA-MB-231 cell, the mean efficiency 53.6% (i.e., lower than average, cf. Fig. 1C); for the MCF-7 cell shown, it is 43.6%.
