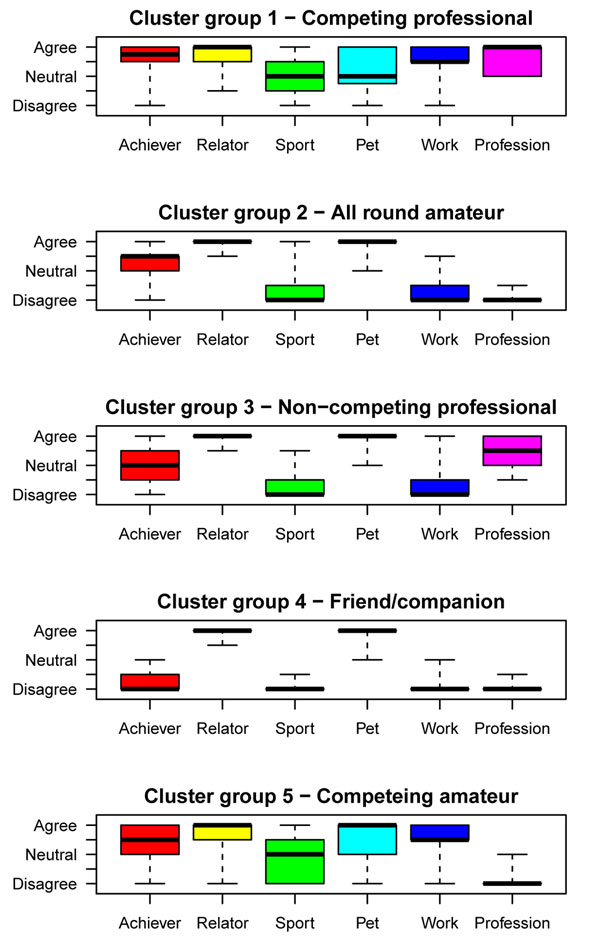
Figure 2.

Responses of each owner typology to the 6 questions used to create the typologies. Each cluster group (cluster groups 1 to 5) is represented within a separate box-and-whisker plot. In each plot, the horizontal axes indicates each of the 6 questionnaire items used to measure aspects of the human-horse relationship (see supplementary information). The vertical axes indicate the strength of agreement with each item. The responses were recorded on a Likert-scale with categories Agree, Somewhat agree, Neutral, Somewhat disagree and Disagree (these were assigned a score of 1 for Agree through to 5 for Disagree). Some questionnaire items (‘achiever’, ‘relator’ and ‘sport’) were recorded on a 10-point scale (see supplementary information). These were converted to a 5-point scale and rounded up for the purposes of plotting. The box-and-whisker plots illustrate the distribution of responses among each cluster group with the boxes representing the median response (heavy black line) and first and third quartile (outer edges of the box), whiskers extend out to the minimum and maximum response. Hence, 25% of data lie between the box and each extreme. In instances where there was limited variation within the data, such that virtually all respondents gave the median response, only the median response is evident, and is shown by a heavy black line.
