Figure 3.
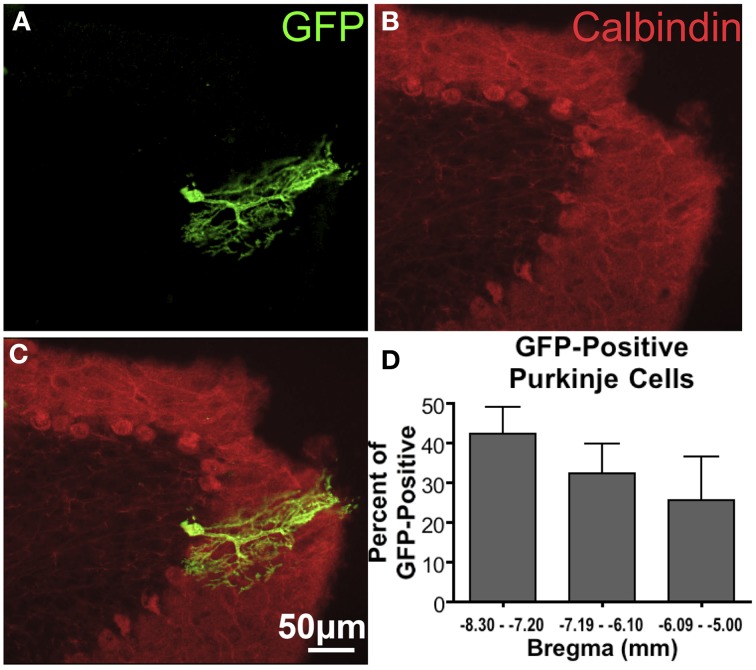
GFP-ir in Purkinje cells of the cerebellum. (A) GFP-ir, showing one labeled cell. (B) Calbindin-ir illustrating the difference in morphology between the molecular, Purkinje, and granule cell layers of the cerebellum. (C) Overlay of images in (A) and (B) illustrating that this GFP-positive neuron is a Purkinje cell. (D) A graph showing the fraction of GFP-positive Purkinje cells found at different distances from Bregma indicates a trend toward decreasing transduction of Purkinje cells in more rostral portions of cerebellum. Only GFP-positive Purkinje cells were counted. The graph represents counted cells for each range of distances from Bregma as percent of all GFP-positive Purkinje cells (78 total cells counted). There was no significant difference in the number of GFP-positive Purkinje cells found in each range of distances from Bregma (One-Way ANOVA, P > 0.05, n = 4).

