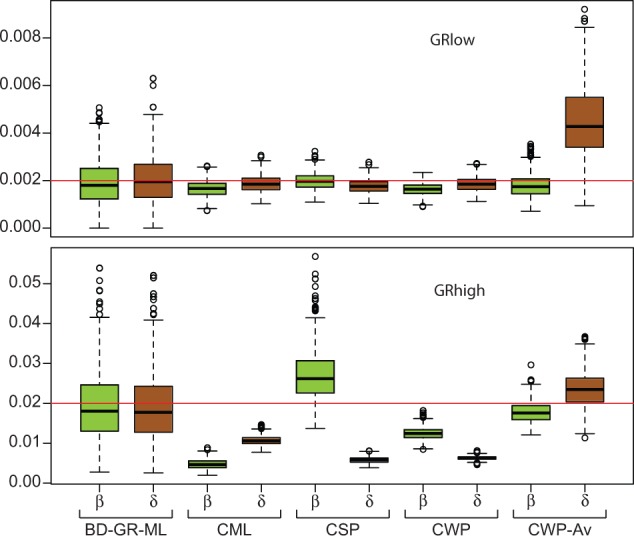
Fig. 2.—

Global birth (β) and death (δ) rate estimates across the simulated gene families of Exp. 1, using different estimation methods. Red line marks the expected (simulated) values. See main text for details.

Global birth (β) and death (δ) rate estimates across the simulated gene families of Exp. 1, using different estimation methods. Red line marks the expected (simulated) values. See main text for details.