Fig. 6.—

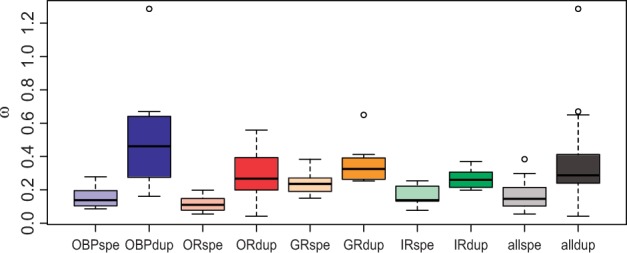
Boxplot summarizing the estimates of ω in speciation (spe) and duplication (dup) branches separately per chemosensory family (OBP, OR, GR, and IR) and the total across families (all).

Boxplot summarizing the estimates of ω in speciation (spe) and duplication (dup) branches separately per chemosensory family (OBP, OR, GR, and IR) and the total across families (all).